April 2022 ties for fifth-warmest April on record
Here are the temperature details from the NOAA National Centers for Environmental Information monthly climate summary:
The April 2022 global surface temperature was 1.53 °F (0.85 °C) above the 20th-century average of 56.7 °F (13.7 °C)—tying with 2010 as the fifth-warmest April in the 143-year record. The 10 warmest April months have occurred since 2010, with the years 2014-2022 all ranking among the 10 warmest Aprils on record. April 2022 also marked the 46th consecutive April and the 448th consecutive month with temperatures, at least nominally, above the 20th-century average.
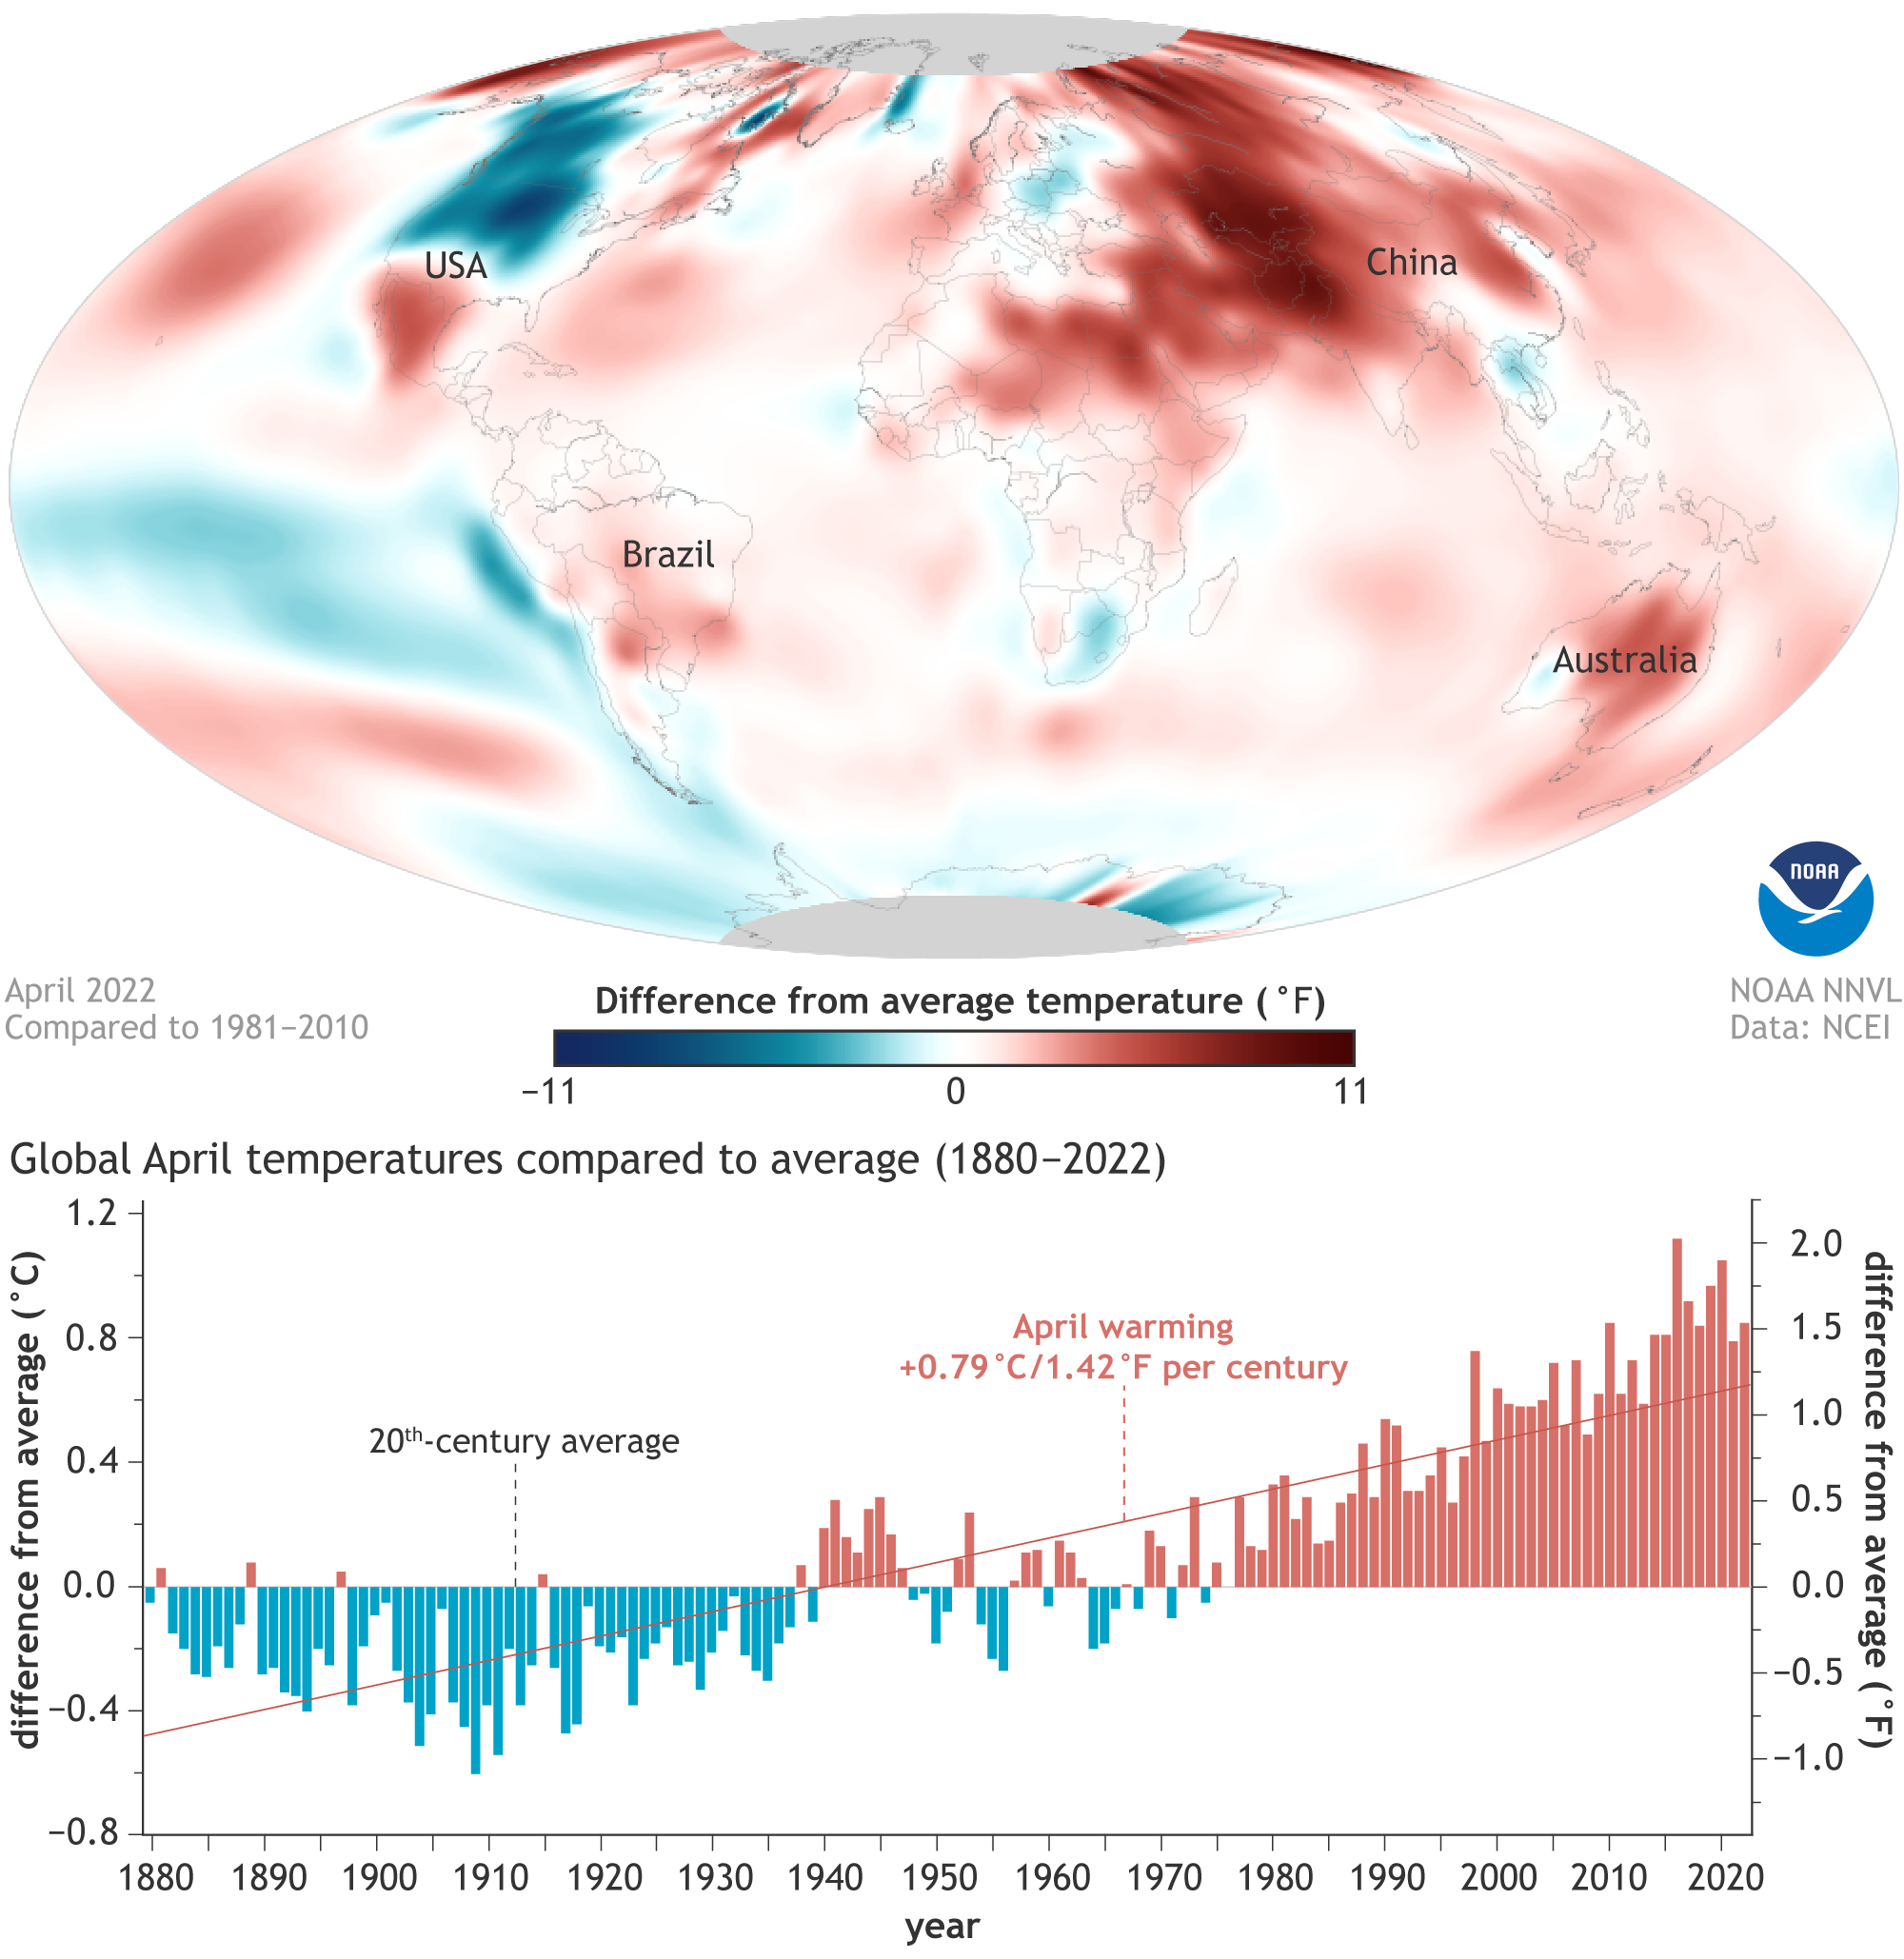
(top) April 2022 temperatures compared to the 1981-2010 average. Places that were cooler than average are colored blue, while places that were warmer than average are red. (bottom) April temperatures each year from 1880–2022 compared to the 20th-century average. April temperatures have been warming by 1.42 degrees F per century. Image by NOAA Climate.gov, based on data from NOAA NCEI.
Temperatures were much above average across parts of southern North America, the Atlantic Ocean, central South America, northern and eastern Africa, southern Asia, Australia, and across much of the Indian Ocean and northern and western Pacific oceans. Meanwhile, near- to cooler-than-average April temperatures were observed across much of central and northern North America, southern South America, central Europe, southern Africa, and central, eastern tropical and southeastern Pacific Ocean.
The influence of the La Niña climate pattern continued to dominate the global precipitation story for April, although its influence in spring is weaker than in winter. A wide swath of the central and eastern tropical Pacific Ocean received a small fraction of its normal April precipitation—the hallmark of La Niña—while parts of the tropical West Pacific in both hemispheres were wetter than average. Precipitation was below average across much of the Indian Ocean, as well.
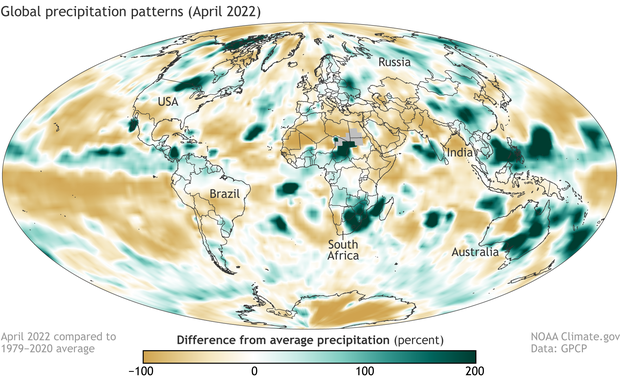
Precipitation across the globe in April 2022 as a percent of average. Places that received less than 100 percent of their average April precipitation are brown; places that received more than 100 percent of their average precipitation are green. NOAA Climate.gov image, based on data from the Global Precipitation Climatology Project.
Elsewhere, some patterns were consistent with a typical la Niña influence, including the dry conditions in the U.S. Southwest and the wet conditions in Northeast Australia, but others were not. In South America, for example, La Niña is more often associated with wetter-than-average conditions to the north of the equator and drier-than-average conditions to the south. In April 2022, that pattern was reversed.
For more details on temperature, precipitation, snow and ice, extreme events, and more, see the NCEI monthly climate report for April 2022.