February 2022 global climate summary: 46th consecutive warmer-than-average February
According to NOAA's monthly global climate summary for February 2022,
Globally, February 2022 was the seventh-warmest February in the 143-year NOAA record. The year-to-date (January-February) global surface temperature was the sixth highest on record. According to NCEI’s Global Annual Temperature Rankings Outlook, it is virtually certain (>99.0%) that 2022 will rank among the 10 warmest years on record.
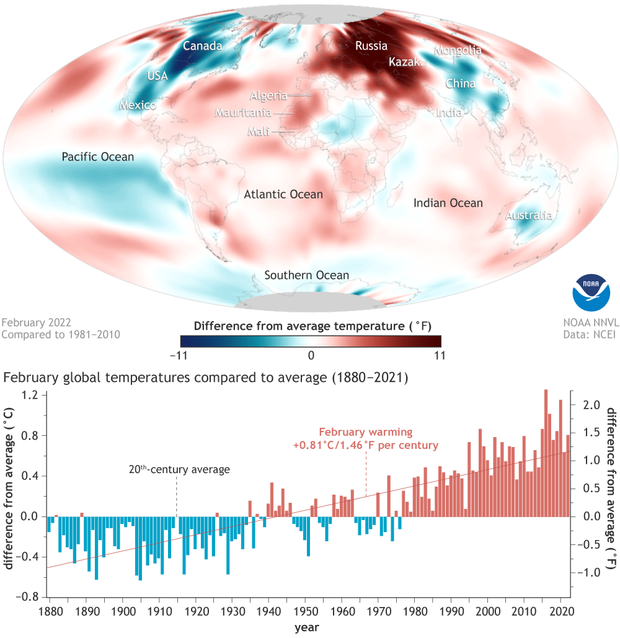
(top) February 2022 temperatures compared to the 1981-2010 average, with warmer-than-average places colored red, and cooler-than-average places colored blue. Extreme temperature contrasts were visible across the Northern Hemisphere, with North America significantly cooler than average and Europe and much of Asia significantly warmer than average. (bottom) Bar graph of each February's temperature compared to the 20th-century average between 1880 and 2022. Below-average Februaries are blue; above-average Februaries are red. The February warming trend over the full period of record is 0.81 degrees Celsius (1.46 degrees Fahrenheit) per century. NOAA Climate.gov, based on data from NOAA National Centers for Environmental Information.
The full February 2022 monthly report provides additional details:
The February 2022 global surface temperature was the seventh highest on record at 0.81°C (1.46°F) above the 20th century average. This value was 0.17°C (0.31°F) warmer than last year's February value (2021), but 0.45°C (0.81°F) cooler than the record-warm February set in 2016. February 2022 also marked the 46th consecutive February and the 446th consecutive month with temperatures, at least nominally, above the 20th century average.
The month of February was characterized by cooler-than-average temperatures across North America, Greenland and its surrounding northern Atlantic Ocean, as well as parts of northern Africa, central and southern Asia, Australia, and the central/eastern tropical and southeastern Pacific Ocean. The most notable cold temperatures were observed across parts of Canada, where temperatures were at least 2.5°C (4.5°F) below average. However, no land or ocean areas had record-cold February temperatures.
Meanwhile, temperatures were much above average across Europe, western/northern Russia, the Atlantic, eastern Indian, and northern and western Pacific oceans, as well as parts of Central and South America and southern Africa. Record-warm February temperatures were observed across parts of the southeastern Atlantic Ocean, southwestern Pacific Ocean and across a small area in the southern Indian Ocean. According to the NSIDC, the Arctic, specifically the Eurasian coast and the central Arctic Ocean, had temperatures that were between 1°–8°C (2°–14°F) above average.
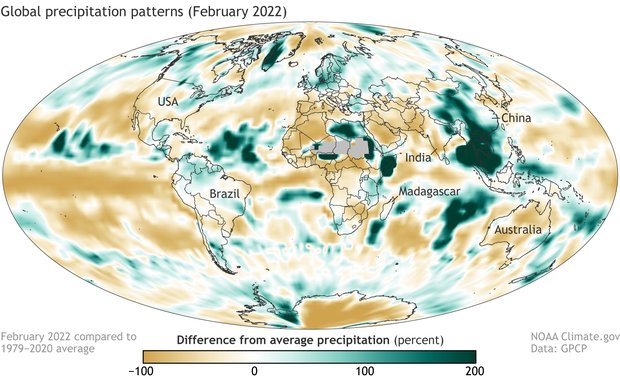
Percent difference from average (1979-2020) precipitation in February 2022. Places where precipitation was near normal (0 percent difference from average) are white. Places where precipitation was up to 100 percent below average (that is, no precipitation) are brown. Places where precipitation was up to 200 percent or more above average are blue-green. The signature of the continuing La Niña climate pattern appears in the tropical Pacific: below-average precipitation in the central and eastern part of the basin and above-average precipitation in the western tropical Pacific north of Australia. NOAA Climate.gov map, based on satellite data from the Global Precipitation Climatology Project.
When it comes to February precipitation, the report noted:
February precipitation was generally drier than normal across the western, central, and southeastern parts of the contiguous U.S., northeastern Brazil, northern Argentina, southern Chile, southern Europe, southern/eastern parts of Asia, and Australia. Wetter-than-normal conditions were notable across parts of the eastern contiguous, Alaska, northern Europe, western Russia, and eastern and southeastern Asia.
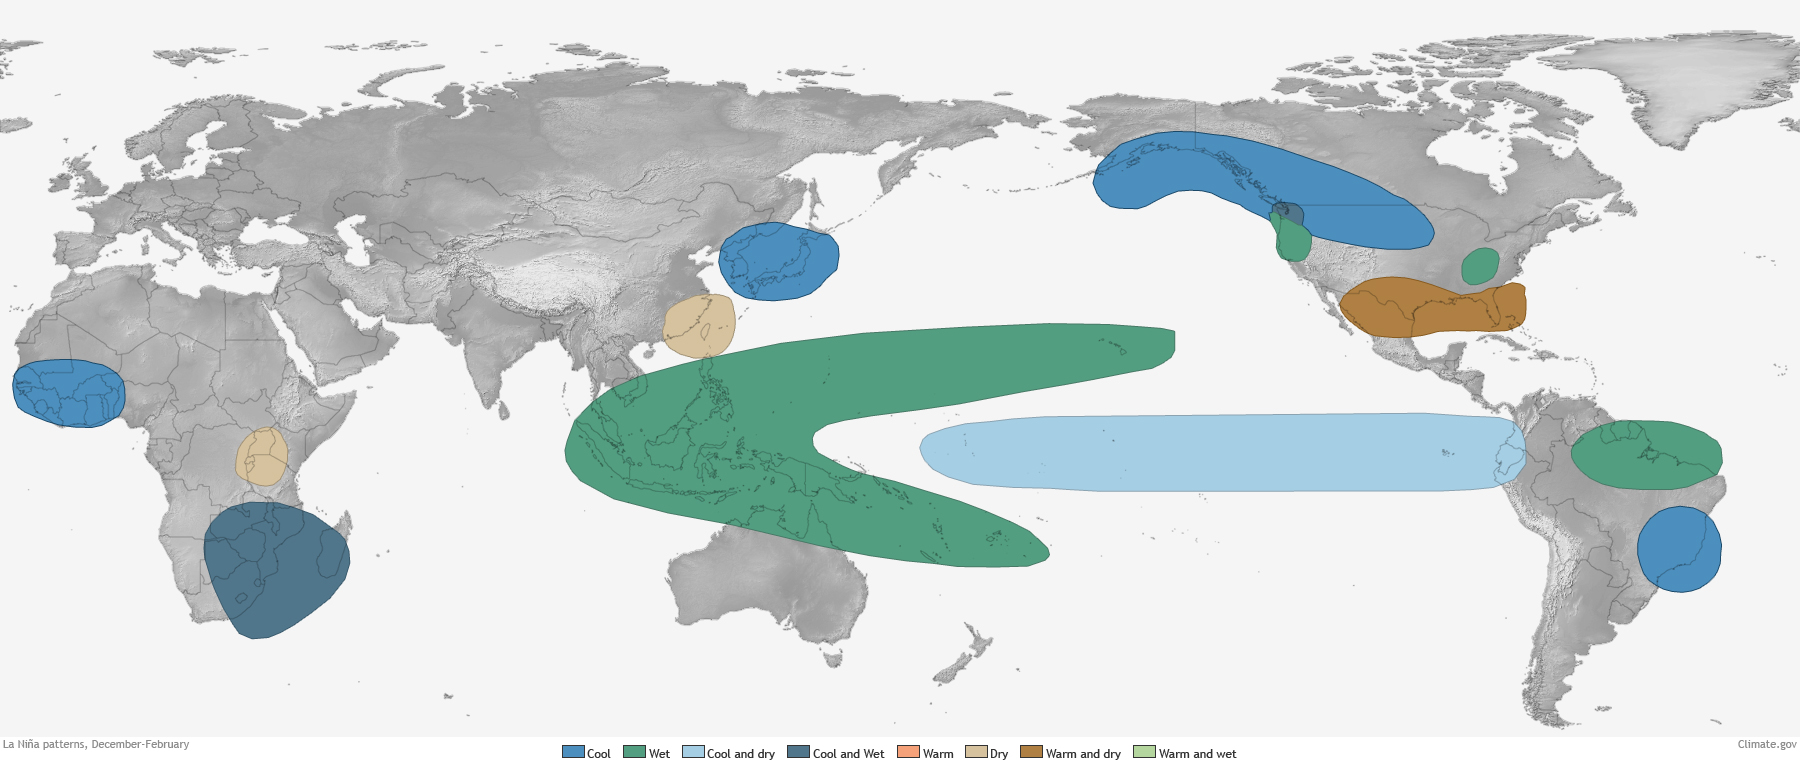
Many of the rainfall patterns in the tropics and mid-latitudes are typical of those that occur during La Niña, the cool phase of the El Niño-Southern Oscillation climate pattern. Although the phenomenon is anchored in the tropical Pacific, it has long-distance influences on the atmospheric circulation that change where and how much it rains in the subtropics and mid-latitudes. The report described several of these:
Outside the tropical Pacific the La Niña effect is also evident in some other locations, including the dry (negative anomalies) zone extending northeastward from the western Pacific, across Hawaii and into the southwestern U.S. and Mexico. This typical La Niña feature has helped to extend in time and increase the intensity of the long-term drought in the southwest U.S. On the wet side, the La Niña-related positive anomaly features over the Maritime Continent and northern South America were associated with rainy season floods and landslides in Malaysia and Indonesia and also in Ecuador, Colombia and Brazil.
For more details about February and winter (Northern Hemisphere) climate, including extreme events, snow and sea ice conditions, and ocean versus land temperature rankings, visit the State of the Climate pages from NOAA National Centers for Environmental Information.