Earth has fourth-warmest October on record in 2021
According to NOAA's October 2021 global climate summary, Earth's average surface temperature in October was 1.60 degrees Fahrenheit (0.89 degrees Celsius) warmer than the twentieth-century average of 57.2 degrees F (14.0 degrees C). That makes the past month the fourth-warmest October in the 142-year record. Octobers have warmed by 1.3 degrees F (0.74 degrees C) per century since 1880, making Octobers today nearly two degrees F (1 degree C) warmer on average than they used to be.
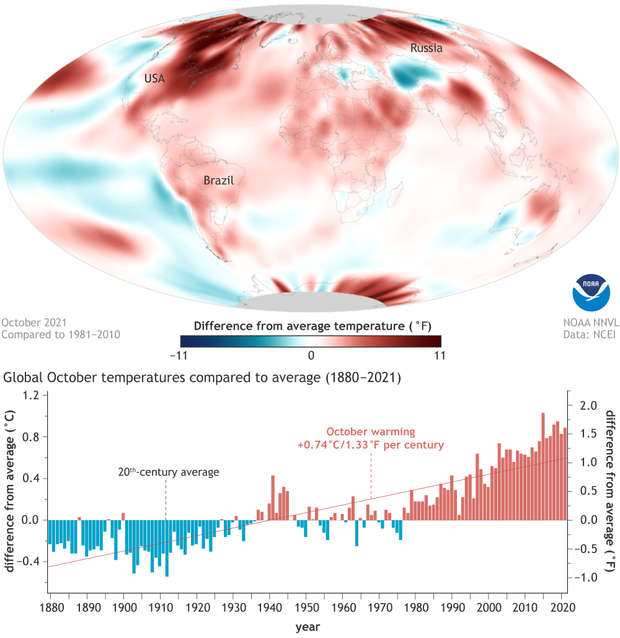
(top) Surface temperatures in October 2021, with places that were warmer than the 1981-2010 average in red, and places that were cooler than average in blue. (bottom) October temperatures from 1880–2021, with red bars for warmer-than-average years, blue bars for cooler-than-average year, and a dashed red line for the long-term warming trend. October 2021 was the 442nd month in a row with temperatures at least nominally above the twentieth-century average. NOAA Climate.gov image, based on data from NOAA's National Centers for Environmental Information.
Unusually high October temperatures were present across much of northern Canada, parts of the northeastern contiguous U.S., north of the equator in South America and Africa, and south-central Asia. The unusually warm temperatures contributed to the warmest October on record for Northern Hemisphere land areas. Only a few scattered locations were cooler than average, most notably the tropical Pacific Ocean, where La Niña—the cool phase of the ENSO climate pattern—was underway.
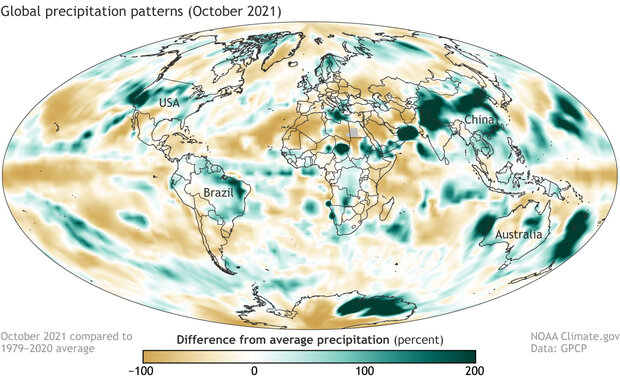
Percent difference from average precipitation in October 2021 compared to the 1979–2020 average. Places where precipitation was up to 100 percent below average are shades of brown; places where precipitation was up to 200 percent above average are blue-green. NOAA Climate.gov image, based on data from the Global Precipitation Climatology Project at University of Maryland.
The influence of La Niña shows up in the October percent of average precipitation map (above), with the strongest influences in the tropical Pacific, where the El Niño-Southern Oscillation pattern is anchored. As is typical during La Niña, rainfall was below average along the equator in the central Pacific and above average over the Maritime Continent and eastern Indian Ocean. More long-distance La Niña impacts show up in the above-average rainfall in northeastern South America and the below average rainfall in northern Mexico and the U.S. Southwest.
For more details on October climate, including updates on sea ice, tropical cyclones, and noteworthy extreme events, see NCEI's Assessing the global climate in October 2021.