2014 State of the Climate: Sea Level
Why sea level matters
In the United States, almost 40% of the population lives in relatively high population-density coastal areas, where sea level plays a role in flooding, shoreline erosion, and hazards from storms. Globally, 8 of the world’s 10 largest cities are near a coast, according to the U.N. Atlas of the Oceans.
In urban settings along coastlines around the world, rising seas threaten infrastructure necessary for local jobs and regional industries. Transportation, energy production, and waste disposal systems that support these populations are also at risk from rising waters.
In the natural world, rising sea level is a stressor on coastal ecosystems that provide recreation, protection from storms, and habitat for fish and wildlife, including commercially valuable fisheries. As seas rise, saltwater is intruding into freshwater aquifers, many of which sustain municipal and agricultural water supplies and natural ecosystems.
2014 update
Even though the oceans are all connected, sea level does not rise or fall uniformly over the planet. On a yearly basis, differences in sea level from place to place are largely due to shifts in the position or strength of major currents or natural climate patterns. In general, warm waters have a greater volume, and thus higher sea level, than cool waters. Scientists measure regional sea level variations using satellite altimetry.
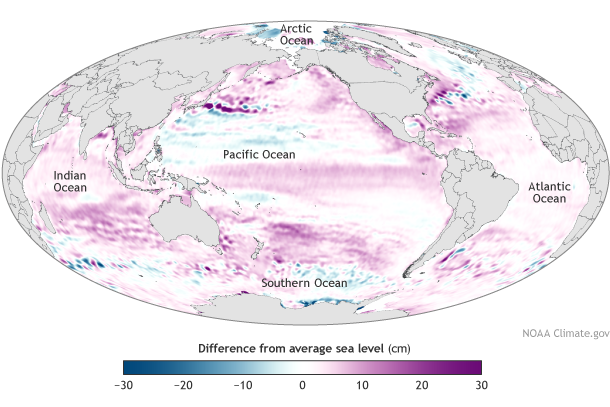
Sea level in 2014 compared to the global average at the mid-point of the 1993-2013 time series. NOAA Climate.gov map, adapted from Figure 3.25a in State of the Climate in 2014.
In 2014, these measurements highlighted recent shifts in both the El Niño-Southern Oscillation and the North Atlantic Oscillation. While 2014 was considered ENSO-neutral, El Nino-like warm signals emerged in the tropical Pacific, favoring higher-than-average sea levels extending eastward across the equatorial Pacific and poleward up the North American coast. The western Pacific experienced a notable drop in sea level in 2014 compared to 2013, which fed into the water volume shift along the equator.
Large areas of lower-than-average sea level extended across the subtropical North Pacific in 2014, while higher-than-average sea levels were present in the subtropical South Pacific across a broad region east of new Zealand. These regional patterns suggest that Pacific subtropical gyre circulations were weaker in the north and stronger in the south during 2014. Sea levels were especially high south of the equator between Madagascar and Australia in 2014, though high sea level anomalies occurred in nearly the entire Indian Ocean basin north of the southern tip of Australia.
Change over time
In 2014, global average sea level was 2.6 inches (67 mm) above the 1993 average, which is the highest yearly average in the satellite record (1993-present). Overall, sea level continues to rise at a rate of one-eighth of an inch (3.2 mm) per year.
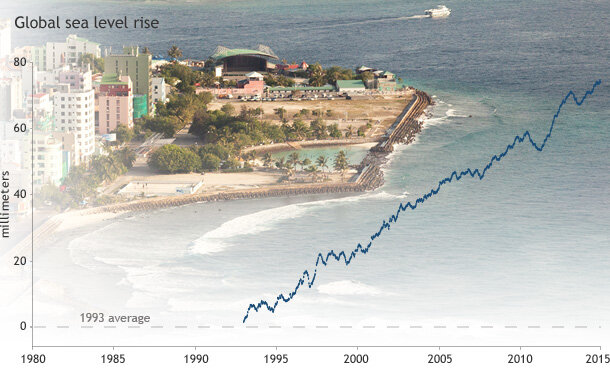
Global sea level each year since 1993 compared to the 1993* average (dashed line). Graph adapted from Plate 1.1x in State of the Climate in 2014. *Update: 7/16, 2:05 p.m. A previous version of this graph incorrectly labelled and identified the baseline as the 1993-2010 average.
Sea level has been rising over the past century, and the pace has increased in recent decades. Part of the increase is due to more water being added to ocean basins—meltwater from glaciers and ice sheets—and part of the increase is due to rising water temperatures: water expands when it gets warmer.
Additionally, about 15% of the trend over the past 2 decades has been attributed to natural variability associated with the Pacific Decadal Oscillation. Some of the year-to-year variations in global sea level trend such as the pronounced dip in 2010–11 and the increased rate in 2012–13 are linked to exchanges of water with the continents, which themselves are often linked to regional climate variations like ENSO and PDO.
References
Hamlington, B.D., R.R. Leben, M.W. Strassburg, R.S. Nerem, and K.-Y. Kim, 2013: Contribution of the Pacific decadal oscillation to global mean sea level trends. Geophysical Research Letters (GRL), 40, 5171-5175.
Merrifield, M.A., P. Thompson, E. Leuliette, G.T. Mitchum, D.P. Chambers, S. Jevrejeva, R.S. Nerem, M. Menéndez, W. Sweet, B.D. Hamlington, and J.J. Marra. [Global Ocean] Sea level variability and change [in “State of the Climate in 2014”], Bulletin of the American Meteorological Society (BAMS), 96 (7), S82-S85.