2013 State of the Climate: Sea level
Why it matters
In the United States, almost 40% of the population lives in relatively high population-density coastal areas, where sea level plays a role in flooding, shoreline erosion, and hazards from storms. Globally, 8 of the world’s 10 largest cities are also near a coast, according to the U.N. Atlas of the Oceans. In urban settings along coastlines around the world, rising seas threaten infrastructure necessary for local jobs and regional industries. Transportation, energy production, and waste disposal systems that support these populations are also at risk from rising waters. In the natural world, rising sea level is a stressor on coastal ecosystems that provide recreation, protection from storms, and habitat for fish and wildlife.
Conditions in 2013
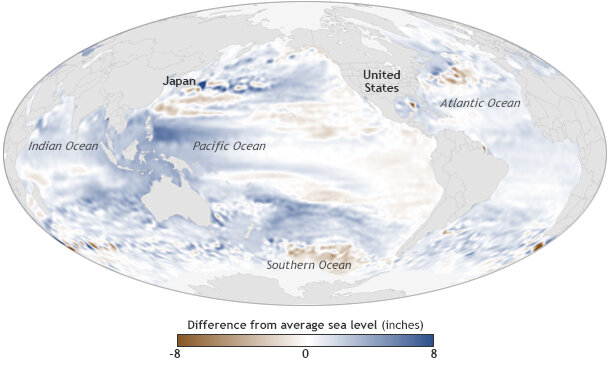
The map shows where average sea level in 2013 was above or below its long-term average. Places where sea level rose up to 8 inches higher than the 1993-2010 average are dark blue, average levels are white, and places where sea level fell below average are brown. Map by NOAA Climate.gov, based on AVISO data provided by Mark Merrifield. Adapted from Figure 3.28(a) in State of the Climate in 2013.
Even though the oceans are all connected, sea level does not rise or fall uniformly over the planet. The map above shows where average sea level during 2013 was above or below its long-term average. On a yearly basis, differences in sea level from place to place are largely due to shifts in the position or strength of major currents or natural climate patterns. In general, warm waters have a greater volume, and thus higher sea level, than cool waters.
Higher-than-average sea surface heights around Australia and Southeast Asia in 2013 reflect the La Niña-like state* of the tropical Pacific and Indian Ocean that existed in the first part of the year. During a full-blown La Niña event, strong easterly trade winds “pile up” warm surface waters in the western part of the tropical Pacific, spilling over into the Indian Ocean, making sea surface temperatures and sea levels there higher than average.
In the North Atlantic and North Pacific, just off the coasts of North America and Japan, sharply divided patches of higher- and lower-than-average sea level trace the dividing line between warm currents and surrounding cooler water: the Gulf Stream in the Atlantic and the Kuroshio Current in the Pacific. The pattern of the anomalies—higher-than-average sea levels sitting north of lower-than-average sea levels—indicates these warm currents were more energetic than normal in 2013, reaching farther north than they normally do.
Farther east in the Pacific Ocean, the pattern of lower-than-average sea surface heights that extends westward across the low latitudes is characteristic of the negative phase of the Pacific Decadal Oscillation.
Change over time
Global sea level from 1993 through 2013 compared to 1993-2012 average, based on AVISO data. Graph adapted from Plate 1.1, panel v, in State of the Climate in 2013.
In 2013, global average sea level was 1.5 inches (38 mm) above the 1993-2010 average, which is the highest yearly average in the satellite record (1993-present). Overall, sea level continues to rise at a rate of one-eighth of an inch (3.2 mm) per year.
Sea level has been rising over the past century, and the pace has increased in recent decades. Part of the increase is due to more water being added to ocean basins—meltwater from glaciers and ice sheets—and part of the increase is due to rising water temperatures: water expands when it gets warmer. Additionally, about 15% of the trend over the past 2 decades has been attributed to natural variability associated with the Pacific Decadal Oscillation, which has been persistently and strongly negative over recent decades.
Year-to-year variations in global sea level trend such as the pronounced dip in 2010–11 and the increased rate in 2012–13 are linked to exchanges of water with the continents. Unlike sea surface temperature, sea level rise shows no sign of a short-term pause in the rate of increase over the past decade.
*El Nino-Southern Oscillation conditions were officially neutral throughout the year, but by some measures, hovered close to La Niña early in the year.
References
M. A. Merrifield, P. Thompson, E. Leuliette, R. S. Nerem, B. Hamlington, D. P. Chambers, G. T. Mitchum, K. McInnes, J. J. Marra, M. Menéndez, and W. Sweet . 2014: [Global oceans] Sea level variability and change [in “State of the Climate in 2013”]. Bull. Amer. Meteor. Soc., 95 (7), S71-S73.