National Climate Assessment: Reducing greenhouse gas emissions will save thousands of lives in the U.S.
Details
Human-caused climate change negatively impacts human health by increasing the frequency and intensity of extreme events, boosting the prevalence and spread of diseases, and by degrading air quality. Worldwide and in the United States, these adverse health effects will worsen as climate change continues, according to the Fourth National Climate Assessment (NCA4). If greenhouse gas emissions are reduced, however, thousands of lives could be saved by the end of this century in the United States.
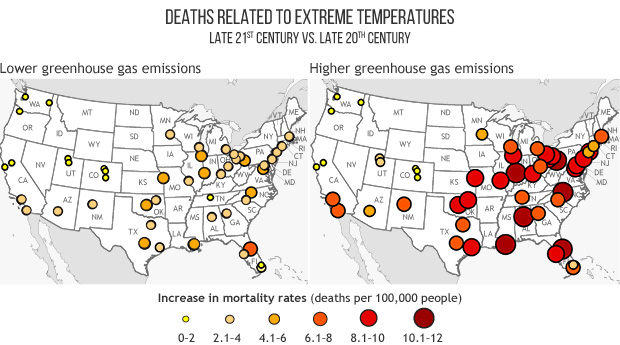
This map from Chapter 14 of the report shows projected changes in the annual net mortality due to extreme heat and cold in 49 cities across the United States depending on the greenhouse gas pathway we choose to follow. The map on the left shows the estimated changes in mortality rate over the coming century if the world follows a lower emissions path (RCP 4.5), while the map on the right shows estimated changes in mortality under a higher emissions path (RCP 8.5).
Compared to today’s rates, researchers estimate that extreme temperatures by the end of the century will cause an additional 9,300 extreme-temperature-related deaths per year across all 49 cities under a higher emissions pathway or an additional 3,900 deaths per year with a lower emissions pathway. Older residents, young children, low-income communities, and some communities of color face greater health risks due to extreme temperatures.
Some cities are better prepared for extreme heat than others. The NCA4 cites Dallas as an example of a city with greater adaptive capacity to the health impacts of extreme heat (e.g. people who’ve lived there for a while can better handle the heat and air conditioning is widely available). If all 49 of the examined cities had adaptations equivalent to those of Dallas, the number of estimated additional deaths for either pathway could be cut in half.
Individuals, communities, states, and nations can all adopt strategies to save lives and money. Regions and states can develop risk reduction and response plans to extreme events, monitor infectious disease spread, prepare healthcare infrastructure to withstand climate change, and use short-term to seasonal forecasts in planning. Individual and local adaptations can include altering urban design—such as building more cooling green spaces in cities—and improving water management.
The report that reducing emissions and increasing climate resilience will save thousands of lives from the effects of extreme temperatures and save hundreds of billions of dollars, and those numbers are likely underestimated. Those estimates don’t include health effects that are harder to quantify, like mental health or long-term health impacts. Developing climate adaptation and resilience could help reduce those impacts as well.