While the summer can mean warm weather, swimsuits, and sunshine, it can also mean wildfire season for parts of North America. And so far, the 2015 wildfire season has been a damaging one across the Pacific Northwest, western Canada, and Alaska in June and July.
In the far north, Alaska’s 2015 wildfire season tally is already over 700 fires, ranking it ninth in history. (The typical fire season ends during August.) The fires have burned nearly 5 million acres, the fourth largest total already and only 200,000 acres away from #2 in the rankings. For perspective, the state’s largest wildfire season on record, 2004, saw 6.5 million acres burned in 701 fires. This year is already at 708 fires which have burned or are burning around 4.8 million acres (numbers as of July 22 from Alaska’s division of Forestry). Fires have destroyed dozens of buildings, and several communities required partial evacuations during June.

Farther south in western/central Canada, wildfires have burned through extensive areas. In an average year, Canada sees around 8,000 fires, which burn around 8,100 square miles. As of July 22, according to the Canadian National Forestry Database, 5,603 fires have burned almost 15,000 square miles of land. That total is larger than the state of Maryland.
The fires have had a far-reaching impact. In Saskatchewan, 13,000 people had to be evacuated in what was called the biggest evacuation effort in the province’s history. Smoke from wildfires in British Columbia and Alberta needed no passport to cross international borders, hitching a ride from the wind and degrading air quality as far as the East Coast of the United States. You can follow the twisting smoke plume back into Canada in the image below taken from NOAA satellites on July 10.
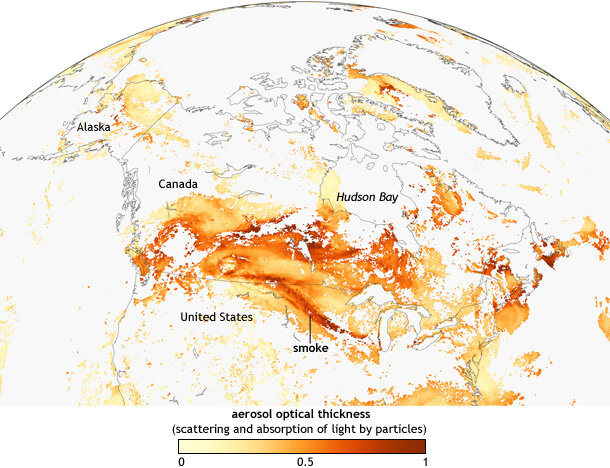
Satellite observation of smoke and other aerosol particles on July 10, 2015. Aerosol optical thickness is the degree to which aerosols prevent the transmission of light through the atmosphere. NOAA Climate.gov map based on NOAA View data.
Meanwhile, wildfires have also popped up throughout the Pacific Northwest with up to a dozen fires throughout Washington on July 6 after a busy June. One fire on the Olympic Peninsula destroyed over 1,500 acres during the end of June, while areas along the eastern slope of the Cascade Mountains, especially around Wenatchee, have been suffering through wildfires as well.
The stage was set for these wildfires by an incredibly dry and hot June across the northwest United States. June ranked as the hottest ever for Washington, Oregon, California and Idaho and the third (Washington) and ninth (Oregon) driest on record dating back to 1895.
Statewide temperature ranks for June 2015 within the historical record (1895-2015), from record coldest (darkest blue) to record warmest (darkest red). Washington was one of several states in the western U.S. that saw its record warmest month on record. Map adapted from analysis by National Climatic Data Center.
Statewide precipitation ranks for June 2015 within the historical record (1895-2015), from record driest (darkest brown) to record wettest (darkest green). Map adapted from analysis by National Climatic Data Center.
In particular, a heat wave at the end of June and beginning of July saw records broken throughout Washington, Oregon, Montana and Idaho. Walla Walla, Washington hit 113°F on June 28, setting Washington’s all-time June temperature record and ranking as the state’s third-hottest day ever recorded. The heat was long lasting, too. Seattle hit 90°F or higher for five straight days, and Boise, Idaho reached at least 100°F for nine straight days, both of which tied a record.
The hot temperatures and a lack of precipitation have caused ground conditions to degrade considerably. Conditions have been so dry that drought has expanded across the Pacific Northwest. As of July 14, 100% of Washington and Oregon and almost 86% of Idaho are in some state of drought according to the U.S. Drought Monitor. Hot and dry conditions help to create the environment in which wildfires can flourish. Vegetation dries out, becoming a fuel for fires—regardless of whether the fires are started by humans or Mother Nature.
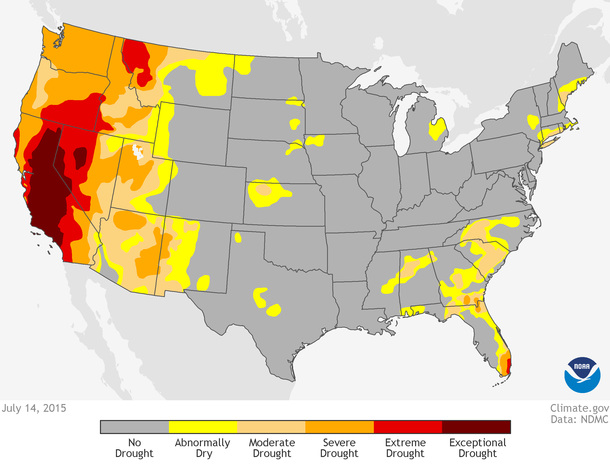
U.S. Drought Monitor issued on July 14, 2015 for the contiguous United States. The more severe the drought, the darker the red color. Map by NOAA Climate.gov, based on data from the U.S. Drought Monitor Project.
One potential influence on the hot and dry conditions across western North America, from the drought in California, to the wildfires extending up to Alaska, has been a consistent ridge of high pressure and associated well-above-average sea surface temperatures off the West Coast. Ocean surface temperatures have ranged from 2-6°F (1-3°C) above normal. This ridge or dome of high pressure, like a boulder parked mid-stream, has helped steer moisture-carrying storms away from the area. The high pressure and warmer-than-average waters also keep temperatures higher than normal, a perfect scenario for an increase in wildfire risk.
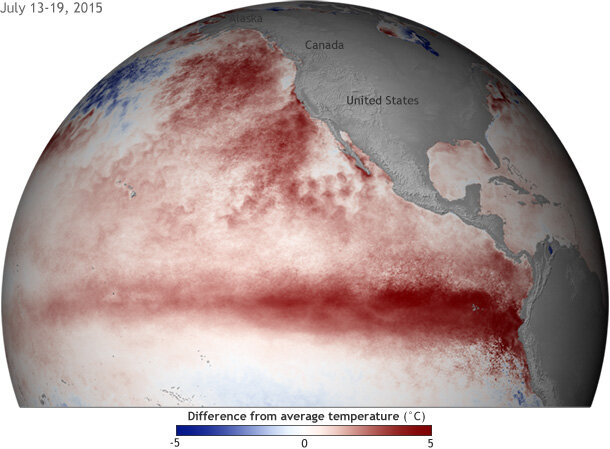
Difference from average (1981-2010) sea surface temperature across the Pacific Ocean from July 13-19, 2015. Darker red shading corresponds with warmer than average sea surface temperatures. Blue shading refers to colder than average conditions. NOAA map based on satellite data.
The outlook?
With help from the currently moderate El Niño that is expected to peak as a strong El Niño later this winter, the odds favor warmer- and drier-than-average seasonal climate conditions across the U.S. Northwest through at least the 2015-2016 winter season. 2015 already has been an active wildfire year, and Mother Nature may not provide much help going forward.