Alongside its somber meaning, Memorial Day weekend is also widely thought of as the unofficial kick-off to the summer: charcoals are lit, grills get hot, and burgers get cooked. This year, across the southeastern United States, the atmosphere decided to send an early preview of what it can actually cook up in terms of summer heat, as record-breaking temperatures soared to the triple digits across parts of Florida, Georgia, and South Carolina.
Daytime high temperatures across the contiguous United States on May 24–June 2, 2019, according to data from NOAA's Real-Time Mesoscale Analysis (RTMA). Temperatures reached at least 100°F in Georgia, Florida, South Carolina, and North Carolina over Memorial Day weekend. Climate.gov animation based on NOAA RTMA data.
A large dome of higher than average pressure allowed for clear skies and the late May sun to cook the region, raising daytime high temperatures 10-20 degrees above average. From May 25-29, 66 sites in the Southeast broke or tied their May monthly high temperature record. On May 25, the high temperature hit 104°F at the University of South Carolina, breaking the May record of 102°F set in 2000. That record lasted three days. On May 28, the temperature hit 105°F. Gainesville, Florida also saw its all-time May temperature record broken twice in two days on May 25 and 26. The hot temperatures reached the coast, too, as temperatures hit 102°F in Savannah, Georgia, on May 26, making it the warmest May day since records began more than 70 years ago.
The heat wave brought record-breaking and triple digit temperatures throughout the Southeast, as Macon (GA), Augusta (GA), Charleston (SC), Wilmington (NC), and Jacksonville (FL) all broke the century mark.
The record heat was tied to a wavy pattern of the jet stream as anomalous high pressure sat over the Southeast and anomalous low pressure resided over the Southwest causing cooler than average temperatures. In between, the Great Plains saw day after day of severe storms and tornadoes as the pressure pattern barely shifted for several days.
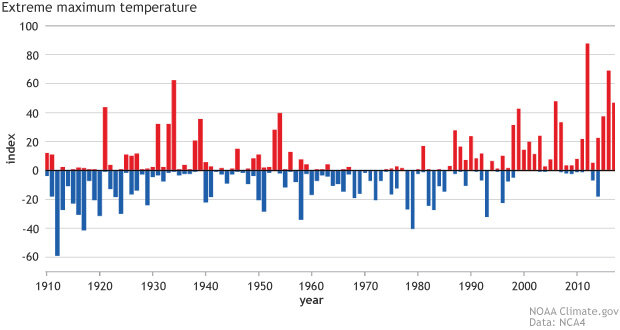
The percentage of land area in the contiguous United States that experienced maximum temperatures greatly above (red) or below (blue) normal (upper or lower 10th percentile, respectively). There is a trend over the last 25 years towards a larger area of the country experiencing warmer extreme temperatures than colder extremes. Figure adapted from FAQ #19 figure A5.20 from the Fourth National Climate Assessment using data from National Centers for Environmental Information.
How has extreme heat changed?
Heat waves are a natural part of U.S. climate. But the Fourth National Climate Assessment has also concluded that extreme high temperatures have become more frequent. From 2001 to 2012, twice as many high temperature records were set compared to low temperature records in the United States (FAQ #19).
Data from the National Centers for Environmental Information tells a similar story. Looking at the percentage of land area in the contiguous United States that experienced maximum temperatures in the hottest (top) or coldest (bottom) 10% of the historical seasonal average, there is a trend over the last 25 years towards a larger area of the country experiencing warm extremes than cold extremes.
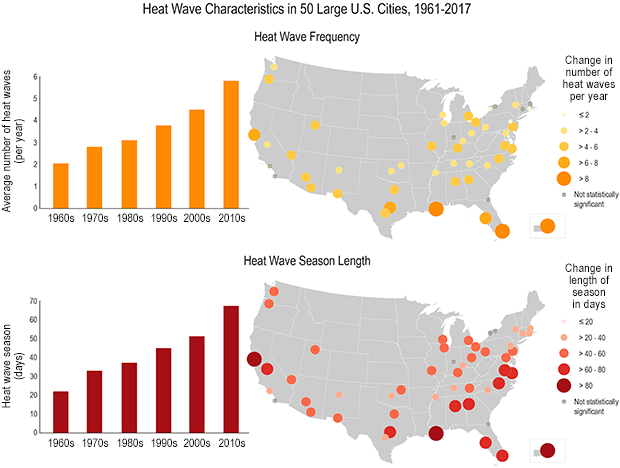
The heat wave indicator shows how the heat wave season has grown longer and how the frequency of heat waves has also increased. From the USGCRP Indicator Platform.
Finally, according to indicators analyzed by the U.S. Global Change Research program, heat wave frequency and length have also increased since 1960, especially across the Southeast. The average heat wave season is now 45 days longer than it was in the 1960s.
What does the future hold for temperatures in the Southeast?
Since I mentioned Savannah above, let’s use it as our test case. Utilizing the Climate Explorer tool in the Climate Resilience toolkit, we can see that Savannah normally experiences just three to four days a year where high temperatures exceed 100°F. By 2050, on both a higher (RCP 8.5) and lower (RCP4.5) greenhouse gas emissions path, the number of days above 100°F reaches around seven. But by 2100, things become extreme under a high greenhouse gas emission scenario: the number of days reaches almost 60, close to two-thirds of the summer. Even a lower greenhouse gas scenario means an increase to 15 days a year with temperatures over 100°F by 2100.
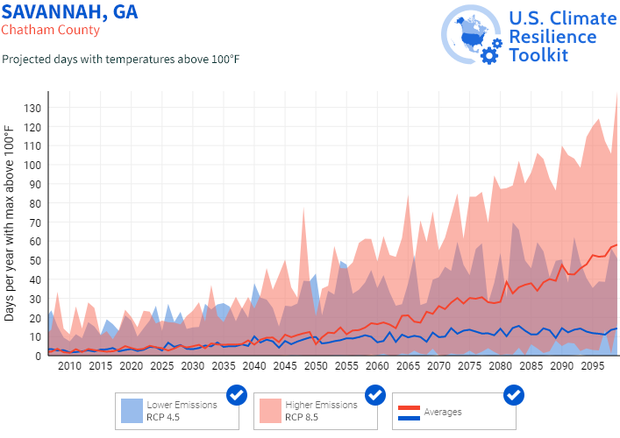
Climate model projections out to 2100 for two possible futures: a lower greenhouse gas emissions scenario (RCP4.5) and higher emissions scenario (RCP8.5) for days exceeding 100°F at Savannah, Georgia. By 2100, under RCP8.5, the median climate model has the number of days exceeding 100°F reaching almost 60. Even under RCP4.5, the number of days increases to 15 days a year by 2100 in the median climate model. Figure adapted from a screenshot from the Climate Explorer located at the Climate Resilience Toolkit.
What are some impacts from extreme heat?
Extreme heat can be incredibly dangerous, especially to vulnerable communities who do not have the ability to adequately prepare and respond to extreme heat events. At its worst, heat stress can led to heat exhaustion, heatstroke, heart attacks, and even death. But it also fundamentally alters how productive humans can be, reducing the amount of hours that can be safely worked in high-risk industries like agriculture, forestry, fishing, hunting, mining, construction, manufacturing, transportation, and utilities. The Fourth National Climate Assessment reports that on a higher greenhouse gas emissions path, by 2090, the Southeast would lose an annual average of 570 million labor hours per year in these industries.
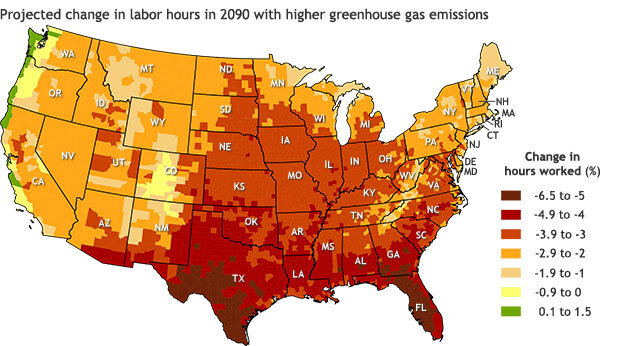
This map shows the estimated percent change in hours worked in 2090 under a higher greenhouse gas emissions scenario (RCP8.5). Projections indicate an annual average of 570 million labor hours lost per year in the Southeast by 2090. Estimates represent a change in hours worked as compared to a 2003–2007 average baseline for high-risk industries only. These industries are defined as agriculture, forestry, and fishing; hunting, mining, and construction; manufacturing, transportation, and utilities. This image was taken from the Fourth National Climate Assessment and was adapted from EPA 2017.

Image caption
This map shows the estimated percent change in hours worked in 2090 under a higher greenhouse gas emissions scenario (RCP8.5). Projections indicate an annual average of 570 million labor hours lost per year in the Southeast by 2090. Estimates represent a change in hours worked as compared to a 2003–2007 average baseline for high-risk industries only. These industries are defined as agriculture, forestry, and fishing; hunting, mining, and construction; manufacturing, transportation, and utilities. This image was taken from the Fourth National Climate Assessment and was adapted from EPA 2017.
The impacts extend to the beef and dairy industries as well, as rising temperatures can lead to an increase in heat stress for livestock, reducing their productivity and ability to reproduce. For dairy cows, this can mean the production of lower quality milk—in 2010, heat stress was estimated to have lowered U.S. dairy production by $1.2 billion according to the Fourth National Climate Assessment. For beef cattle, higher temperatures lead to reduced appetites and grazing.
To learn more about heat health and to make sure you and your community are prepared for extreme heat, head to the National Integrated Heat Health Information System (NIHHIS) where you can access resources on extreme heat resilience and adaptation and forecasts. So that you, too, can help reduce health-related risks before and during heat waves.