For much of the U.S, odds are tilted toward well above average warmth in May-July 2018
Details
If you've been wondering if temperatures are ever going to warm up or whether you'll be watering your garden more or less frequently in coming months, here's some news. On April 19, the National Weather Service’s Climate Prediction Center issued its latest seasonal outlook, which covers the period from May through July, and odds are titled toward relative warmth for the start of summer for most of the country, with wetter than average conditions also favored in the northeastern United States.
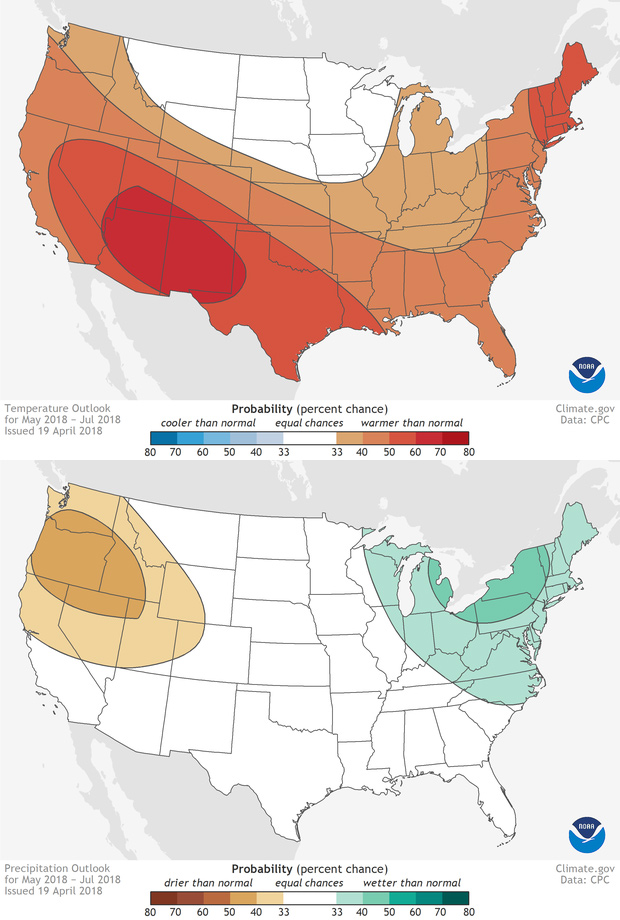
These maps use colors to show where May, June, and July temperature and precipitation are favored to be well above, well below, or near average: red and blue for temperature, green and brown for precipitation. Darker colors mean higher chances, not bigger departures from average. White areas mean all three forecast possibilities—above-, below-, and near-average conditions—have the same chances of occurring. For the scope of these forecasts, well above and well below mean “in the upper or lower third of the values in the 1981-2010 record.”
The May through July temperatures are favored to be well above average across most of the United States, but the chances are higher in some areas than others. The regions most likely to find things relatively warm this May-July, with a better than 50% chance, are the southwestern United States, Texas, northern Alaska (click to see large version of the map), and New England. Only one region—the High Plains—has odds that are not tilted in favor of warmer than normal temperatures. Instead, there are equal chances for above-, below-, and near-average conditions.
The odds for precipitation during May through July are a bit more varied. There is a slight tilt towards an unusually wet May, June, and July across Alaska, the Great Lakes, the Mid-Atlantic, and the Northeast. Meanwhile, much drier than average conditions are favored for the Pacific Northwest and northern California, stretching into the Mountain West and parts of the southwestern United States. (Not good news for the region’s ongoing drought.)
Forecasters look at a variety of tools when they craft the seasonal three-month temperature and precipitation outlooks. “Tools” like the long-term trends in temperature and precipitation, the state of the El Niño Southern Oscillation (ENSO), the amount of moisture in the soil (a lack of moisture can lead to warmer than average temperatures), and a whole suite of climate models all are factored in the forecast. But each of these “tools” might be telling a different story, or no story at all. These overlapping—sometimes conflicting—signals create uncertainty, which is why scientists assign probabilities to their climate outlooks.
These forecasts are updated monthly so be sure to check out the latest in Climate.gov’s Data Snapshots or at the Climate Prediction Center.