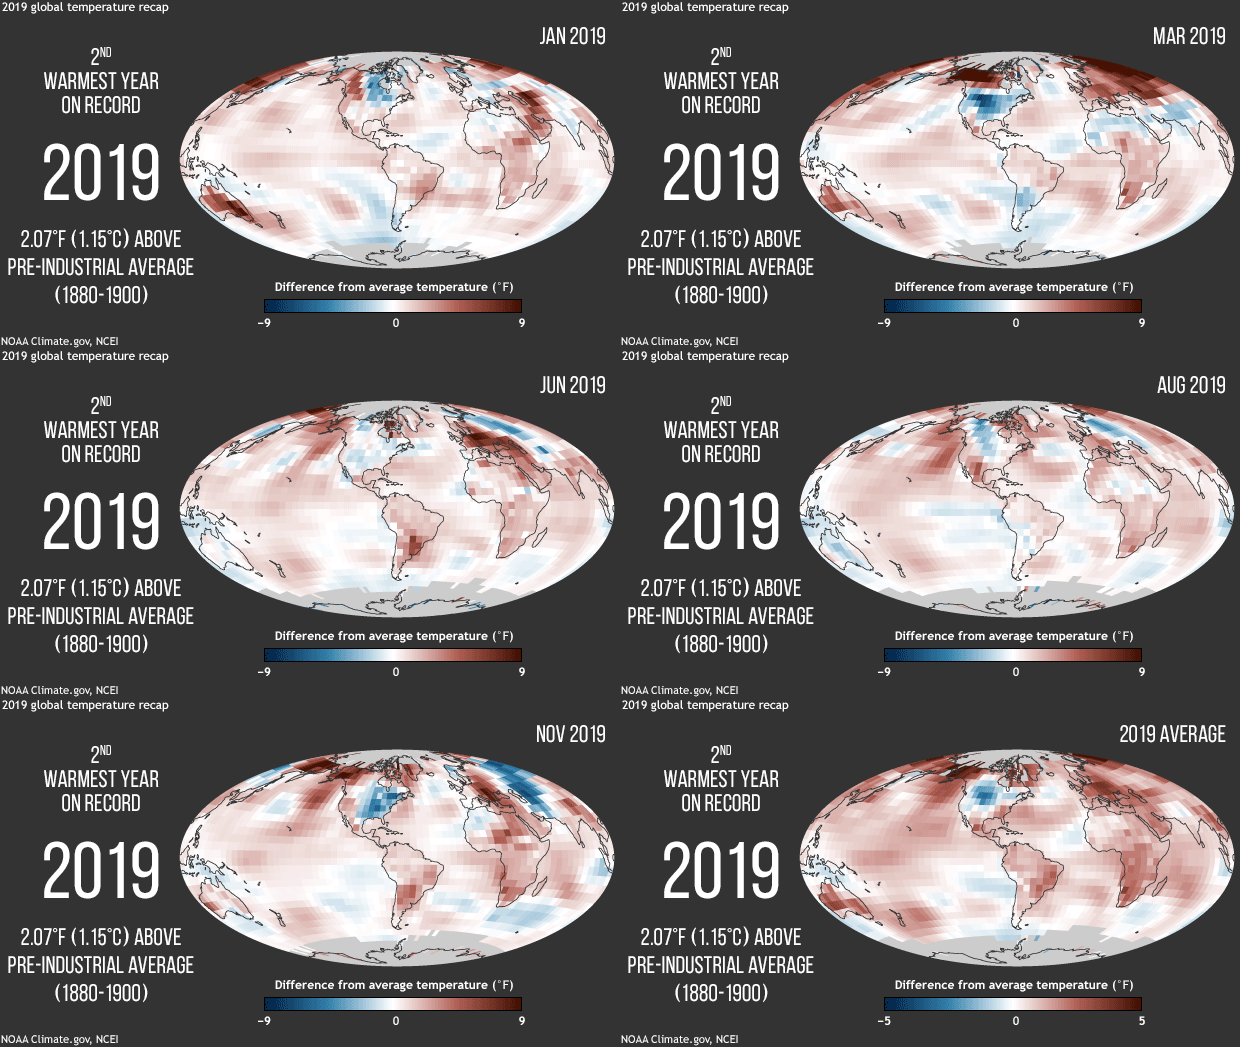
2019 was second-warmest year on record
Details
On January 15, 2020, NOAA released its recap of 2019 climate conditions. Combined measurements from the land and ocean surface show that the planet's long-term warming trend continues. The average temperature was 1.71°F (0.95°C) above the twentieth-century average. It was the second-warmest year in the historical record dating back to 1880, and the amount of heat energy stored in the top 2,000 meters of the ocean was the highest on record.
The animated gif at right shows how temperatures throughout 2019 compared to the 1981-2010 average, showing each month from January–December and ending with the 2019 annual average. Places that were warmer than average are shades of red, and places that were cooler than average are blue. The monthly range of variability is larger than the annual range, so the monthly maps are scaled from -9 to +9 degrees Fahrenheit, while the annual map is scaled from - 5 to +5 Fahrenheit.
The contrasts between unusually warm and unusually cool areas are larger over land than ocean, and they shift around more from month to month. Parts of Alaska, southern Africa, central Europe, and Australia experienced their warmest year on record, but no areas experienced their coldest year. In fact, the only land area worldwide where temperatures averaged over the year were cooler than average was a small pocket of the northern United States.
Highlights from the 2019 Global Climate Report
- 2019 marks the 43rd consecutive year (since 1977) with global land and ocean temperatures at least nominally above the twentieth-century average.
- The five warmest years have occurred since 2015; nine of the 10 warmest years have occurred since 2005. The year 1998 is the only twentieth-century year among the 10 warmest years on record.
- The annual global land and ocean temperature has increased at an average rate of +0.13°F (+0.07°C) per decade since 1880; however, since 1981 the average rate of increase is more than twice that rate (+0.32°F / +0.18°C).
- For the 21-year span that is considered a reasonable surrogate for pre-industrial conditions (1880–1900), the 2019 global land and ocean temperature was 2.07°F (1.15°C) above the average.
Read more highlights on 2019 temperature, precipitation, and snow and ice conditions from NOAA's National Center for Environmental Information here.
