Details on the August 7th ENSO Discussion: how has the forecast changed?
This month’s ENSO Diagnostic Discussion starts off with “the chance of El Niño has decreased to about 65% during the Northern Hemisphere fall and early winter.” The last few months, chances were estimated to be around 80% for El Niño to have formed by the fall/early winter. So, we’ve gone from an estimated 1-in-5 chance that we won’t have an El Niño to a nearly 1-in-3 chance. However, 65% is still almost twice the climatological likelihood – that is, the long-term average of how often we experience El Niño conditions – so forecasters are still predicting El Niño will develop.
So, why the decrease in the odds of El Niño?
Last month, we discussed how the atmosphere has yet to respond to the sea-surface temperatures, and Michelle went into a bit more depth about a possible explanation for why the atmospheric response may be delayed. As of the beginning of August, we still haven’t seen a strong atmospheric response (the SOI is -0.2, and the EQSOI is 0.1), and the sea-surface temperature in the central-Eastern Pacific has cooled, leading the weekly Niño3.4 index to drop to -0.1°C by the end of the month. A few other observations have contributed to the somewhat more conservative forecasts, such as the slightly below-average (cooler) ocean heat content.
Given these observed conditions, why are chances even as high as 65%? There are a few different considerations that are leading forecasters to these probabilities, including computer model forecasts of sea-surface temperature, and forecasts that the recently developed westerly wind anomalies along the equatorial Pacific may continue.
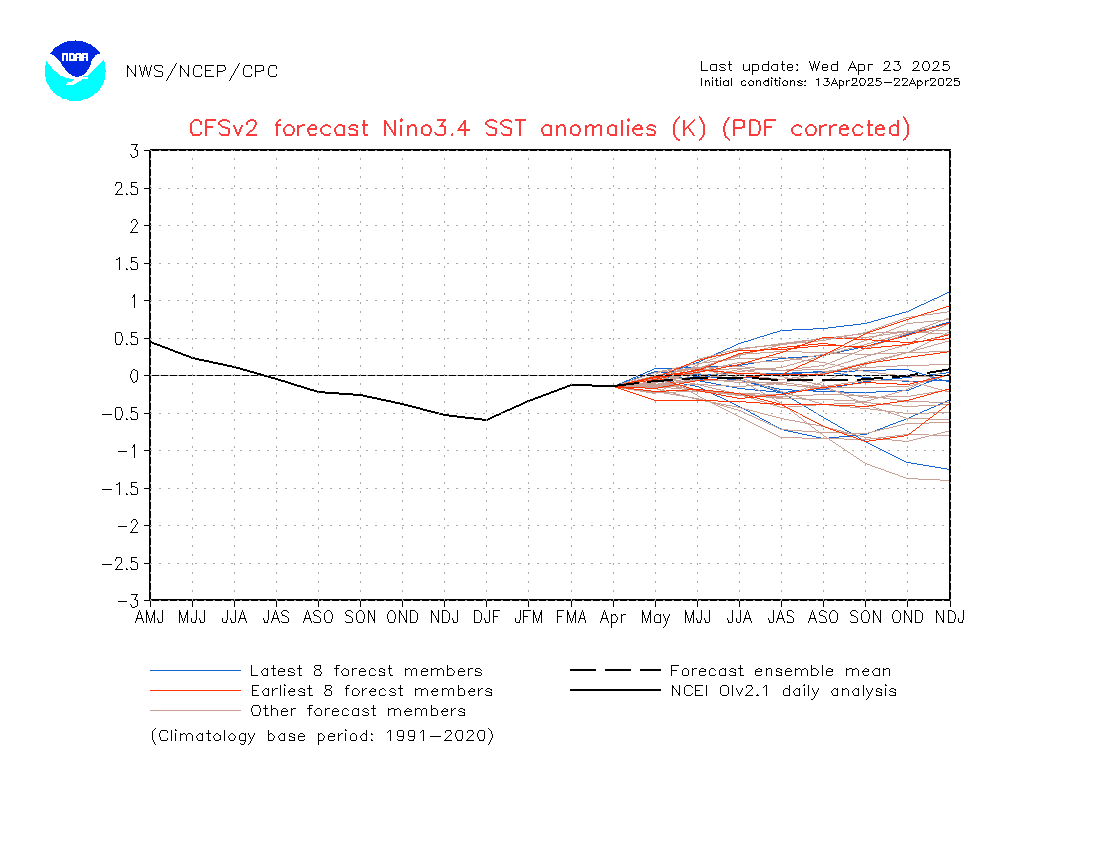
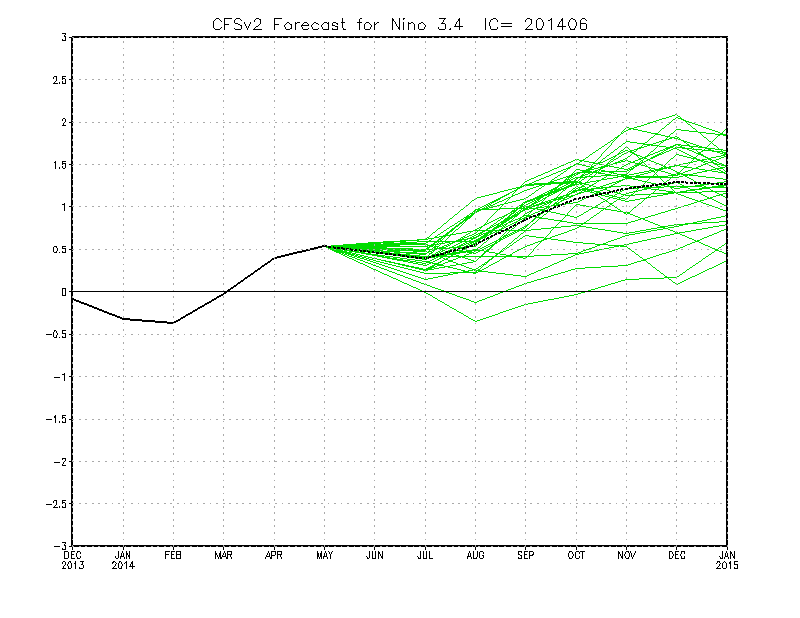
The forecast takes into account several dynamical climate models, including the Climate Forecast System version 2 (CFSv2, Fig. 1) and the eight-model National Multi-Model Ensemble (NMME). One of the many products of these models is the forecast for the Niño3.4-region sea surface temperature. The models are run many times to form an ensemble of forecasts, each time with a slightly different set of “initial conditions” – that is, the observed fields (such as temperature, air pressure, and so on) that provide the starting point for the forecast. A common way to get different initial conditions is to run the model a few times per day, for example at midnight, 6 a.m., noon, and 6 p.m. The results of the many runs are averaged to yield the ensemble mean, a kind of model consensus.
Climate Forecast System version 2 (CFSv2) ensemble forecast for Nino3.4 sea-surface temperatures. Figure from CPC.
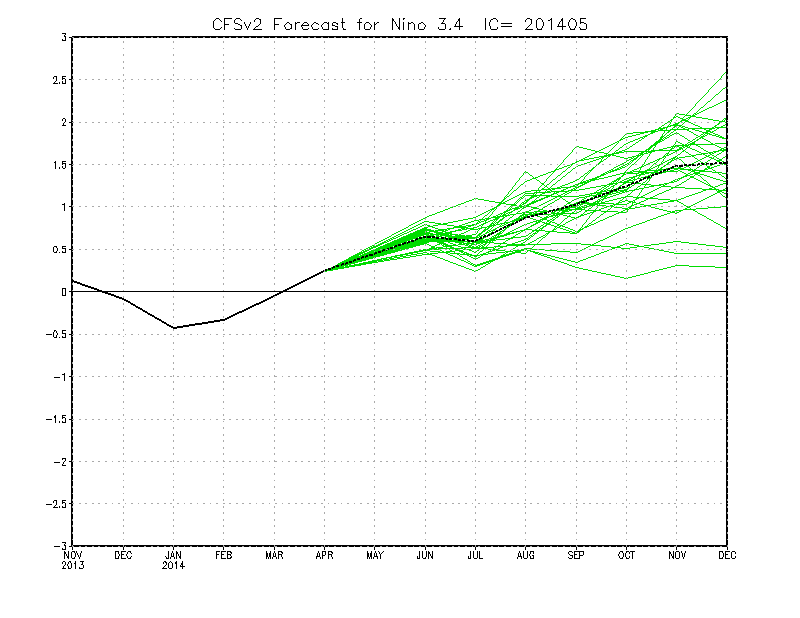
CFSv2, which is run four times per day (each colored line in Fig. 1 represents one “model run”, and the black dashed line shows the ensemble mean) continues to consistently forecast a weak-to-moderate El Niño, peaking in the early winter. In addition, all of the NMME models are still calling for El Niño conditions to develop, with most in the “weak” range of +0.5°C to +0.9°C (Fig. 2).
Why do forecasters lean toward trusting the models, despite the fact that conditions seem to be trending away from an El Niño-friendly state? Among the reasons is that the CFSv2 predicted the current dip in sea surface temperatures in the Niño3.4 region in both May and June, which indicates they have a good handle on how the climate is behaving. That lends credibility to the prediction of El Niño by fall/winter. Several of the NMME models also predicted the dip in July (Fig. 2; the CFSv2 that’s included in the NMME is the same model as that shown in Fig. 1.)
July North American Multi-Model Ensemble (NMME) ensemble forecast for Nino3.4 sea-surface temperature. Figure from CPC.
One way that forecasters evaluate model output is by counting how many of the individual runs fall into a specific category, such as “above normal”, “near normal”, or “below normal.” The number of runs in each category, divided by the total number of model runs, gives us a percentage (see Fig. 3 for an example.) The black box in Fig. 3 indicates the Niño3.4 region; as you can see, more than 70% of the model runs fall in the “above average” category for the December-January-February sea surface temperature forecast.
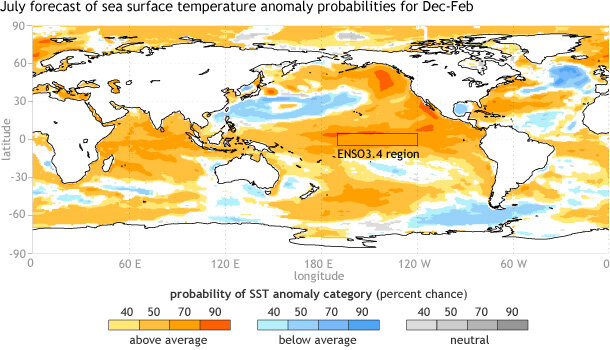
Figure 3: North American Multi-Model Ensemble (NMME) probability forecast for sea-surface temperature in Dec-Jan-Feb 2014-15. Figure from CPC.
The climate models look out several months into the future. A near-term factor that is being closely watched by forecasters is the change in the winds along the equatorial Pacific. As we’ve mentioned earlier, the winds along the equator usually blow from east to west, keeping warmer water piled up in the Western Pacific. If these winds relax, or even reverse, this warmer water can move to the east. (A couple of these “westerly wind bursts” back in the winter kicked off the downwelling Kelvin wave this spring.) Toward the end of July, the typical easterly winds again relaxed some (westerly wind anomalies appeared), and there is some suggestion these wind anomalies may continue.
As Tony explained a few weeks ago, climate forecasting (including ENSO forecasting) is all a matter of probabilities. While the forecast chance has decreased, there is always plenty of uncertainty on just what will happen. As we’ve said, even a forecast of 80% for an event means there’s a 1-in-5 chance that the event won’t happen; now, while we’re estimating a 65% chance that El Niño will happen, that means a roughly 1-in-3 chance that it won’t.
Comments
Something which I have been
RE: Something which I have been
Details on the August 7th ENSO Discussion: how has the forecast
RE: Details on the August 7th ENSO Discussion
There are ways to verify a probabilistic forecast. Let's use a coin with two outcomes (heads-tails) as an example. If you were to make a probabilitic forecast for heads, you would predict 50% chance of heads, right? To verify this forecast in observations (i.e. to see how good the forecast was), what you would do is count how many times you obtained heads. What you *should* see is that close to 50% of the time, you obtained heads.
For example, If you predict heads 80% of the time and then saw heads occur 50% of the time, then your forecasting is "unreliable." The predicted probabiity should MATCH (or nearly match) the observed probability. Forecast reliabilty is a score and you can read more about it here:
http://www.metoffice.gov.uk/research/areas/seasonal-to-decadal/gpc-outl…
... there are many other probabilistic scores as well.
Note that you need a longer record (lots of coin flips in observations) in order to verify how good your forecast is. Going back to the coin flipping analogy, it is easy to randomly obtain "runs" of consecutive heads or tails (H - H - H - T - H) so using a short record to verify your probabilistic forecast is a no-no. After many coin flips, the observed probability should settle down around 50%.
Keep in mind ENSO is a THREE outcome "coin" (see Tony's post: http://www.climate.gov/news-features/blogs/enso/why-do-enso-forecasts-u… ).
RE: RE: Details on the August 7th ENSO Discussion
RE: RE: RE: Details on the August 7th ENSO Discussion
CPC/IRI started jointly putting together probabilistic ENSO forecasts in early 2012, so unfortunately the record is too short to quantify our reliability scores, but we plan to verify in the future. It is easier to develop robust statistics for forecasts made more often (i.e. every day), but in our outlooks, we only obtain data points once monthly, which requires time to verify.
However, our probabilities do not stray too widely from more objective probabilistic tools, which the forecasters view and take into account. For example, there are results using 30 years of CFSv2 reforecasts (or hindcasts) that show that model tends to be a touch overconfident at longer forecast leads (i.e. the model tends to forecast slightly higher probabilities than what were actually observed).
You can also view archives of IRI’s probabilistic forecasts based on the ENSO model plume, which are available here:
http://iri.columbia.edu/our-expertise/climate/forecasts/enso/ (click on the month/year on the top right and click "plume based probabilistic ENSO forecast')
And there is an archive of CPC ENSO diagnostics discussions going back to 2001, if you want a more qualitative estimate of how good the forecasts are:
http://www.cpc.ncep.noaa.gov/products/expert_assessment/ENSO_DD_archive…
Comments have been disabled on this article