In our previous posts, we’ve described how the bitter cold in the United States and Canada during the first week of January was connected to the weakening of an atmospheric phenomenon known as the polar vortex. Now forecasters are predicting a similar cold snap for the end of January. Given all the chatter this winter, it's worth taking a step back to look at the larger picture: how does the polar vortex relate to that other major winter weather influence—the Arctic Oscillation?
The much-hyped polar vortex is a permanent fixture of the atmospheric circulation at both poles. Far from the equator and pitched into complete darkness each winter, the polar vortex contains the hemisphere’s coldest air. From the Arctic southward, the air gets warmer, gradually at first, but then rapidly. That rapid-transition point is where you find the polar jet stream—a fast-moving river of air that blows around the globe from west to east. The jet is the outermost edge of the vortex.
While the key characteristics of the polar vortex—the fastest jet speeds and coldest air—are most pronounced at high altitudes, the same temperature, wind, and air pressure patterns can reach all the way down to the surface, especially in the winter, which is where the Arctic Oscillation* comes in.
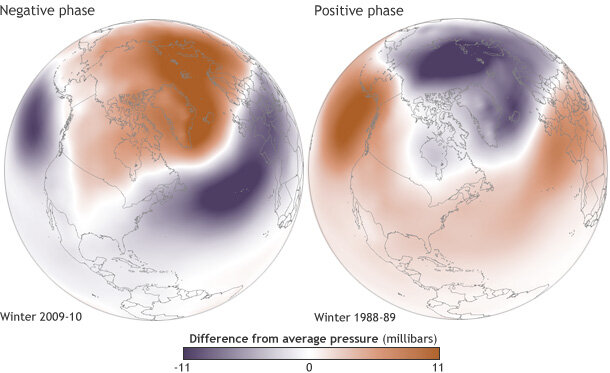
Difference from average pressure at sea level during strongly negative (left, December 2009-February 2010) and positive (right, December 1988-February 1989) phases of the Arctic Oscillation. Higher-than-average pressure is orange; lower-than-average pressure is purple. Maps by NOAA Climate.gov, based on NCEP Reanalysis data provided by NOAA ESRL, Physical Sciences Division.
The Arctic Oscillation describes simultaneous, geographically “choreographed” shifts in multiple features of the polar vortex: air pressure, temperature, and the location and strength of the jet stream. They all follow the hemisphere-wide oscillation of atmospheric mass back and forth between the Arctic and the middle latitudes, sort of like water sloshing in a bowl.
At one extreme of the sloshing, there is lower-than-average air pressure over the Arctic and higher-than-average pressure over the mid-latitudes. The jet stream is farther north than average under these conditions, and it steers storms northward of their usual paths. The mid-latitudes of North America, Europe, Siberia, and East Asia generally see fewer cold air outbreaks than usual. These are all characteristics of a strong, “well-behaved” polar vortex. When the atmosphere is in that state, the Arctic Oscillation Index, which tracks relative pressure anomalies across the N. Hemisphere, will have large, positive values.
At the other extreme, the conditions are reversed. Air pressure is higher than average over the Arctic and lower than average over the mid-latitudes. The jet stream shifts southward of its average latitude and can develop waves or “kinks,” with “troughs” that help steer frigid, polar air southward. These are all characteristics of a weak polar vortex. When the atmosphere is in that state, the Arctic Oscillation Index will have large, negative values.
“The polar vortex is often considered to be a stratospheric phenomenon, but our AO index measures the ‘surface expression’ of the polar vortex.” explains Michelle L’Heureux of the NOAA Climate Prediction Center.
Interestingly, the Climate Prediction Center did not measure large negative AO index values during this last outbreak because the polar vortex was not weaker across the entire hemisphere—just near North America and eastern Siberia. While Canada and the eastern U.S. froze, many locations around and within the Arctic Circle including Alaska, Scandinavia, Europe, and western Russia enjoyed warmer-than-average temperatures. So the event was not a complete breakdown of the polar vortex, according to L’Heureux.
The cold outbreaks that occurred during the 2009-2010 winter are a more classic example of what you might expect to see during a very strong and persistent negative phase of the AO (weak polar vortex). In early December 2009, the Arctic Oscillation flipped into a strongly negative phase, shifting the jet stream southward and funneling frigid blasts of Arctic air into North America, Siberia, and Europe. People in those areas experienced much colder-than-average temperatures during December 2009 – February 2010.
While the Arctic Oscillation has not yet experienced a strongly negative phase this year, scientists are noticing a trend toward more frequent negative phases since the mid-1990s. No one really understands why but a lot of ideas currently being researched, including whether natural decadal variability, sea ice loss, and the influence of snow cover on the ground are playing a role.
As for what we can expect in the near future, the CPC produces forecasts of the AO and NAO out to two weeks. Currently, temperature outlooks from the Climate Prediction Center indicate increased chances for another cold snap across the central and eastern United States in late January. As of January 21,** model predictions of the phase of the Arctic Oscillation were mixed, with the mean suggesting a shift from negative to near zero or slighly positive in the next 14 days. But according to L'Heureux, the wide range of predictions indicates low confidence in the forecast during the second week of the outlook, which means the models are very uncertain about how the Arctic Oscillation will ultimately behave at the end of the month.
*While the AO describes the entire hemisphere, its close cousin—the North Atlantic Oscillation—is mostly confined to the North Atlantic Ocean. Because they are so closely related, they are often referred to interchangeably. The NAO is a fluctuating air-pressure pattern that alternatively enhances or blocks the storm-steering jet stream over the North Atlantic. The NAO and AO are measured using different indexes, but they are often referred to together as AO/NAO because their indices are typically strongly correlated during the winter. During the winter of 2009-2010, both the NAO and AO were in a very strong negative phase. This latest cold outbreak was one case where they were not in strong alignment; in early January 2014, the NAO index was near zero.
**UPDATED on January 21 to reflect informaiton from the latest model runs for the Arctic Oscillation forecast.
Related Links
National Snow and Ice Data Center (2014, January 10) What is a polar vortex?
NOAA Climate Prediction Center: Teleconnections (AAO, NAO, PNA & AO)
NOAA (2011, February 28) Warm Arctic, Cold Continents