Out of the 29 Northern Hemisphere summers that led up to a winter El Niño, how many were hot versus cold? Wet versus dry? These maps are a global climate scorecard for the influence of El Niño on June-August climate.

July is the hottest month of the year. How hot might it be in the future?
When forecasters remove the observed trend from sea surface temperatures, the predicted heat wave area drops from 50 percent of the global ocean to 25 percent.
Climate outlooks are different from weather forecasts, and it's easy to misunderstand what the maps are telling us. Let us explain.
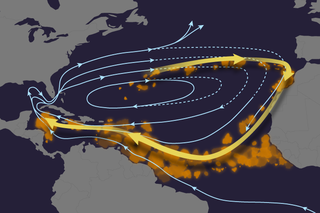
The warm phase of Earth's most powerful natural climate pattern appears to be on its way.
Poster-sized collection of global temperature maps since 1850 makes it easy to spot the influence of global warming.