It was the perfect winter to launch a polar vortex blog
As we’ve mentioned a few times before in this blog, the stratospheric polar vortex has been pretty active this winter. The screaming-fast winds that circle the North Pole high above the surface during Polar Night have completely reversed twice. (And in between those two events, there was a maybe: the west-to-east winds* at 60 degrees fluttered around zero, but may not have actually reversed for long enough to officially qualify.)
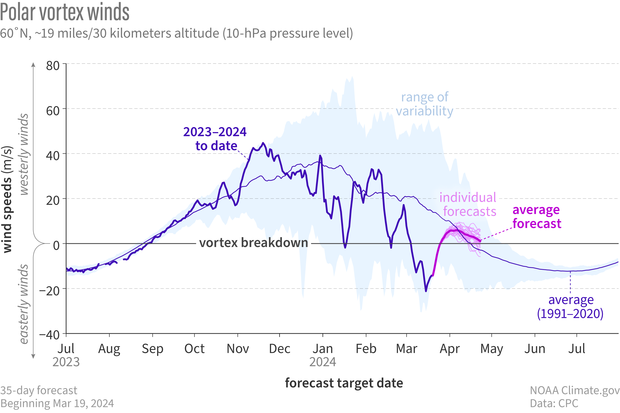
Westerly wind speeds in the polar vortex for the 2023-24 winter (dark blue line). The season has been active, with at least 2 disruptions (dips below the zero line, which mean that the prevailing west-to-east winds at 60˚North have reversed directions). The exact count won't be known until later in the spring. For example, the forecast (light magenta line) says that the vortex will recover from the most recent breakdown. If it does not, then the event will be counted as the "final warming," which is the normal end of each season, not an in-season breakdown. NOAA Climate.gov graph, adapted from original by Laura Ciasto.
As such events often do (it’s why we pay attention to them!), the one in January probably played some role in the extreme cold in the central U.S. in January that kept the winter from being a complete bust. (Footnote 1).
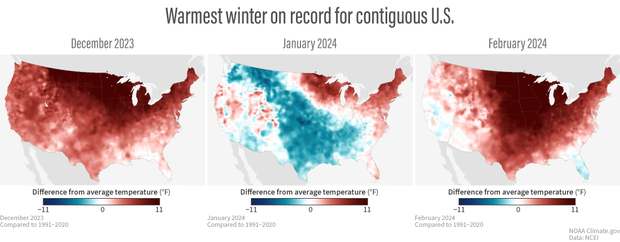
(left to right) Monthly temperatures for December, January, and February compared to the 1991-2020 average for the contiguous United States. Despite a swatch of cooler-than-average temperatures across the central part of the country in January, the winter overall was the warmest in the 130-year record. NOAA Climate.gov maps based on data from NOAA National Centers for Environmental Information (NCEI).
All this starting, stopping, reversing, and collapsing has given us plenty to talk about in this blog’s first season, which is great because, as we’ve pointed out before, some winters come and go without a single interesting thing happening in the stratosphere. That would have been boring for you and challenging for us. Instead we got plenty of drama. Whew!
Now you might be wondering: did you know ahead of time this would be a good year to launch a Polar Vortex blog, or did you just get lucky? Well we did…and we did. Let’s consider some simple stats.
Odds of polar vortex collapse boosted during El Niño
If you make a table of the month and year of all polar vortex collapses/sudden stratospheric warmings and sort it by what was happening in the tropical Pacific—whether the planet’s most influential natural climate pattern was in its El Niño, La Niña, or neutral phase—one thing quickly becomes obvious: more events happen in El Niño and La Niña winters than neutral ones.
Of the 42 events identified in the ERA5 reanalysis dataset, 17 happened during El Niño winters, 16 during La Niña winters, and only 9 during neutral winters. Digging a little deeper, it’s worth noting that of the subset winters that produced 2 sudden stratospheric warmings, the tilt toward El Niño gets a little stronger. Out of 7 winters with 2 sudden warmings, 4 of them occurred during El Niño winters, 2 during La Niña, and 1 during neutral. (Footnote 2)
Based on the historical record, then, there is nearly twice as much chance that the polar vortex will fall apart in an El Niño winter (17 events) than during a neutral winter (9 events). Given that we knew as far back as April 2023 that this winter was likely to feature El Niño, we did know we had much better chances of stratospheric shenanigans this winter than in an ENSO neutral winter. ("ENSO" is the nickname for El Niño-Southern Oscillation, the whole El Niño, La Niña, ocean-atmosphere phenomenon.)
But not all the El Niños
I also said we got lucky. Where does the luck come in? Well, so far, I only looked at the question one way: are polar vortex disruptions more likely to happen in El Niño or La Niña years than in neutral years. But we also have to look at the question the other way: how often does an El Niño winter produce a polar vortex breakdown? Viewed from this angle, the odds are less favorable.
If I look back at the historical record of El Niño and La Niña episodes since the start of our most reliable sea surface temperature record, I count up 26 El Niño winters. (Footnote 3.) So, out of 26 El Niño winters, only 17 of them (65 percent) produced a polar vortex collapse. We could have found ourselves in the 35 percent of El Niño winters where nothing much happens. Given these odds, it’s clear we also got lucky.
Why are El Niño, La Niña and the polar vortex connected?
Naturally, you want to know why this connection exists. After all, El Niño and La Niña affect sea surface temperatures and convection (thunderstorm activity) in the tropical Pacific Ocean. All those things are occurring well below the altitude of the stratosphere. Is this some sort of quantum-entanglement, spooky-action-at-a-distance magic?
Fortunately, the explanation is more straightforward than that. I’m going to reach back to a guest post that Amy did for the ENSO blog in its early years. In it, she wrote,
ENSO influences climate all over the world by generating planetary-scale “wave trains” that shift the jet stream and associated weather patterns. During El Niño winters, these wave trains may occur more often in an ideal location to strengthen into the stratosphere.
Remember that we showed you what that ideal location looked like in our post from January 8. The key feature is deep low pressure over the Aleutian Islands in the North Pacific. This tropospheric circulation pattern is the most favorable for producing planetary wave trains that jostle the stratosphere from below in just the right place and time to cause a vortex collapse. And it turns out, that’s the exact circulation pattern that tends to recur throughout an El Niño winter.
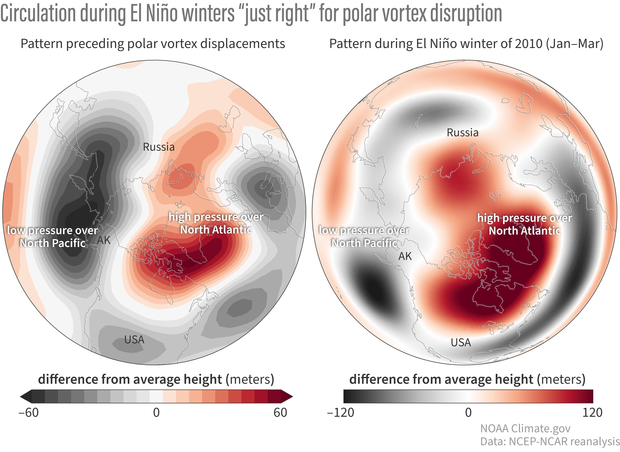
El Niño puts the atmosphere in the mood for polar vortex breakdowns. (left) Average pressure patterns in the 14 days before all polar vortex collapses from 1958-2023, with higher-than-average atmospheric thickness (aka geopotential height) in red and lower-than-average pressure in gray. (right) Average January-March pressure patterns during an El Niño event in 2010. This particular arrangement—low pressure over the North Pacific and high pressure over the North Atlantic—is common during El Niño winters, and it happens to be the pattern most favorable for triggering polar vortex displacements. NOAA Climate.gov image based on data provided by Amy Butler (left) and by NOAA Physical Science Lab (right).
But…what about La Niña?
If you’re paying attention, you noticed that according to the historical record, polar vortex breakdowns/sudden stratospheric warmings are as likely during La Niña as El Niño. How can that be, if the circulation during La Niña is the opposite of El Niño? Wouldn’t that mean the circulation was not particularly friendly to the sort of wave trains that disrupt the polar vortex?
The fact is, we can’t explain it. When scientists use large ensembles of models—meaning many different models run many, many times with slightly different initial conditions—to simulate the occurrence of sudden stratospheric warming events, the models say that the disruptions should occur more often during El Niño than during La Niña. But the historical observations don’t reflect that.
Amy says we don’t yet know whether the problem is with the models or with the observations. Maybe the occurrence of sudden stratospheric warmings is so variable that it will take a longer observation history than we currently have for El Niño polar vortex collapses to pull away from La Niña collapses. But it’s also possible that during La Niña, there are different processes that are also favorable for triggering collapse and sudden warming, and our models aren’t capturing them. For now, it’s a mystery!
El Niño with a side of polar vortex
The final question you might be asking yourself is if temperature impacts during El Niño winters that have polar vortex breakdowns/sudden stratospheric warmings are different from those that don’t. The short answer is yes; average winter surface temperatures are different for El NIño winters with and without polar vortex disruptions/sudden stratospheric warmings. If you want to know how, be sure to come back for our seasonal recap post in early April, as Amy and Laura will be diving into that.
*Editor's note: Revised on April 26, 2024. This sentence originally said, "...the vortex’s west-to-east winds...". It's been revised to prevent confusion between the polar vortex as the average atmospheric flow of the polar stratosphere and as a specific manifestation of that circulation on a given day. For more context, read We're going to stop saying "polar vortex reversal".
Footnotes
- As far as possible impacts from the near-miss that happened around Feb 19 and the second full-on collapse that occurred on March 4, you’ll have to wait for our next expert-led post. Normally, the way this blog works is that Amy and Laura write the posts, and I look over their shoulders and offer essential feedback like “We need to reduce the number of acronyms in this piece by at least half” and “Can you think of a plain-language way to say empirical orthogonal function?” Due to some unforeseen circumstances, however, the Polar Vortex blog finds itself without an expert blogger this week. So I’ll be writing, and Amy and Laura will be looking over my shoulder with insightful commentary like, “Yes, it’s true that a collapse of the polar vortex can flush extremely cold air into the midlatitudes, but we still don’t think you should liken it to an overflowing toilet,” and “No, a planetary wave isn’t a tsunami in the atmosphere.”
- Other datasets have a similar pattern, even if the exact numbers of events are a little different. That table doesn’t yet include the 2 events that have happened this winter. Assuming they both wind up meeting the criteria to be included in the database, then the number of sudden stratospheric warming events during El Niño winters will climb to 19 in the ERA5 dataset, and the number of double-event winters that were also El Niño winters will increase to 5 out of 8.
- If you want to check my work, look for the DJF boxes colored red. “DJF” stands for December-January-February average; red means they were part of an El Niño event.
Comments
USA average temps
A great showing of USA temps this winter (Monthly temperatures for December, January, and February compared to the 1991-2020 average for the contiguous United States.). Very informative pages for a retiree in FL.
MAHALOS!
USA temps
Thanks for this feedback! As we were developing that graphic, I referred to it as "the warm-winter sandwich". Then i spent some idle time thinking about how we usually describe sandwiches by what's inside, and so really, i should have called it "the cold January sandwich" image...And then i thought about how "warm winter sandwich" sounds like something you'd rather eat than "cold January sandwich"...and then i reminded myself to stop thinking about sandwiches because I knew it was salad for lunch day and I was just setting myself up for disappointment. :-)
Blog
Your blog has been informative: It's answered some questions I had had about the stratospheric polar vortex, and it has taught me other things. Thanks, and keep up the good work.
Re: blog
Thanks for taking a moment to leave us this feedback!
Vortex reversal and Beaufort Gyre release
Just a question, will the decline of the polar vortex have any affect on the Beaufort Gyre’s release of fresh water as anomalies have been found this year there too ?
Thanks for the question!…
Thanks for the question! From what I understand the release of freshwater from the Beaufort Gyre (BG) can be impacted by the Arctic Oscillation (AO) which is characterized by pressure changes over the Arctic and the mid-latitudes (https://www.climate.gov/news-features/understanding-climate/climate-var…). We haven't discussed it yet, but when the polar vortex is disrupted, its downward impacts can manifest as a negative AO, which could impact the BG freshwater release.
That said, while the AO has been negative at times over the last month, it does not seem like it's strongly related to the recent major sudden stratospheric warming.
Add new comment