Summer weighing heavily on Greenland Ice Sheet
In late July, NASA announced that satellites had detected signs of melting across virtually the entire surface of the Greenland Ice Sheet in mid-July, even at the two-mile-high summit of the ice cap—a first for the satellite record and a historically rare occurrence based on ice core data.
The unusual melting event followed several months during which high pressure systems repeatedly parked over Greenland. As many a weather forecaster has explained, high pressure generally leads to calm winds and sunny skies, both of which boost temperatures during the all-day sunshine of mid-summer at high latitudes.
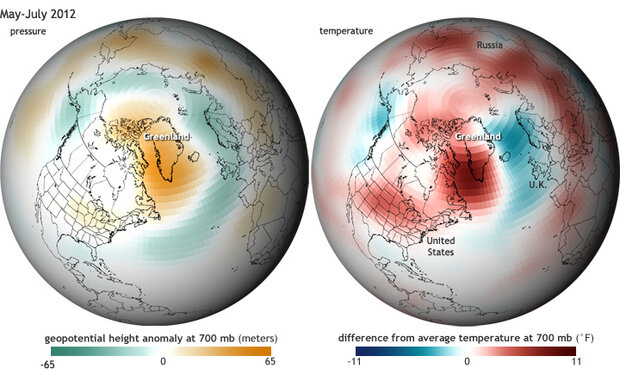
Geopotential height is like a topographic map of the atmosphere. Imagine climbing a mountain. As you climb, the air gets thinner; the pressure drops. The geopotential height describes how high you have to climb before the pressure drops to a given value. A 700-millibar anomaly of 65 meters means that there is so much extra air over that spot on Earth that you’d have to climb 65 meters higher up the mountain than average before you reached the altitude where the air pressure dropped to 700 millibars. The “700-millibar temperature” means the temperature of the atmosphere at the altitude where the pressure is 700 millibars. Maps by Dan Pisut, based on reanalysis data provided by NOAA/ESRL Physical Sciences Division.
The map on the left shows the difference from average pressure at the 700 millibar pressure level from May-July 2012 compared to the 1981-2010 average. Gold colors indicate higher-than-average pressure. A large dome of high pressure camped over Greenland and the Northwest Atlantic this summer. The influence on temperatures (map on right) was dramatic. Temperature anomalies at the same altitude were as much as 11 degrees Fahrenheit warmer than average over Greenland.
At Summit Station, a research camp at the top of the Greenland ice sheet, the temperatures made a clear excursion above freezing in mid-July, lending supporting evidence to the satellite observations of ice melting even at the ice sheet’s highest location. Temperatures flirted with the melting threshold again late in the month.
The graph below shows hourly average summer temperatures at Summit Station, Greenland. Gray lines show temperatures from 2005-2011; 2012 summer temperatures through late July are shown in red. Even compared to the past 7 years—globally some of the warmest on record—the 2012 summer temperatures at Summit Station stand out for their repeated warmth.
Graph adapted from original by Mike Schnaubelt and Christopher Shuman, UMBC-JCET at NASA-GSFC, based on NOAA data provided by Tom Mefford.
Strong anomalies of both high and low pressure come and go across Greenland and the North Atlantic over the span of weeks to months, and they exert a powerful influence on regional weather and seasonal climate. In addition to favoring cloudless skies, high pressure tends to bring southerly winds across western Greenland, providing another warming influence.
Research published earlier this year found that since the late 1950s, the 6 warmest summers and 5 of the 6 largest melt years in Greenland have occurred since 2000. A similar “dome” of persistent high pressure was common to each of the episodes, but it is probably not the sole cause of the unusual warmth and melting.
Scientists continue to investigate how the anomalous atmospheric circulation pattern interacts with other climate conditions, including natural cycles of ocean temperature in the North Atlantic and human-caused climate change, to influence the summer melt rate on the Greenland Ice Sheet.
References
Hanna, E., Jones, J. M., Cappelen, J., Mernild, S. H., Wood, L., Steffen, K., & Huybrechts, P. (2012, in press). The influence of North Atlantic atmospheric and oceanic forcing effects on 1900-2010 Greenland summer climate and ice melt/runoff. International Journal of Climatology. doi:10.1002/joc.3475
Links
Satellites Observe Widespread Melting on Greenland
NOAA Summit June-August Temperatures—1-hour averages
Greenland Ice Sheet Getting Darker
Greenland Ice Sheet Surface Melting, 2000-2011
Reviewed by James Partain, Jim Overland, John Nielsen-Gammon, Ted Scambos, Walt Meier, Christopher Shuman, and Edward Hanna.
![]()