No doubt, 2016 has had a record-breaking warm start to the year, following a record-smashing warm 2015. But even so, it was highly unusual to see the Greenland Ice Sheet begin to melt by the second week of April.
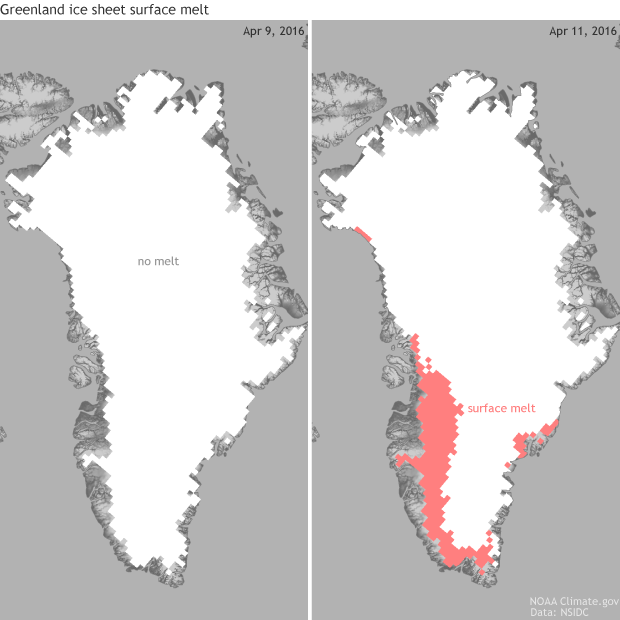
Melt patterns on the Greenland ice sheet measured for two days April 9, 2016 (left) and April 11, 2016 (right). Melt areas are determined from algorithms based on microwave satellite data which produce an estimate of melt. While no melt was present on April 9, on April 11 about 10% of Greenland's ice sheet began to melt. April 11, 2016 was amongst the earliest dates on record for at least 10% of Greenland's ice sheet to begin to melt. Map by NOAA Climate.gov and Fiona Martin based on data from the National Snow and Ice Data Center/Thomas Mote, University of Georgia.
Greenland’s ice melt season really kicks into gear during the summer months when temperatures rise above freezing and precipitation, if any, can fall as rain. However, during a six-day period during the second week of April (April 10-15), a backed-up atmospheric pattern allowed for unseasonably warm and rainy conditions to overtake Greenland. The warm and wet conditions caused unusually early melting to occur for southern Greenland’s ice sheet.
The specific pattern of this atmospheric traffic jam is known as an “omega block” because the jet stream is contorted enough to resemble the Greek letter omega. It is called a “block” because an anomalous high-pressure system acts like an atmospheric mountain, blocking anything from going through it; instead, air must flow around it. In this case, Greenland found itself under the high pressure, which allowed for air that normally resides in the mid-latitudes to stream north to the Arctic.
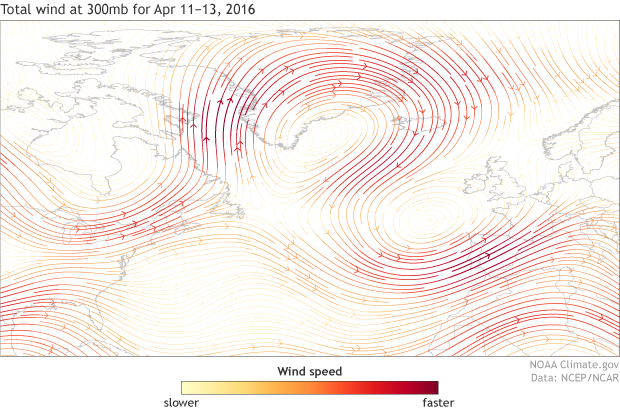
300mb averaged wind for April 11-13, 2016. During the period, an atmospheric "omega block" over the Atlantic Ocean as illustrated by the wind streamlines taking the shape of the Greek letter Omega. Southerly winds brought warm and moist conditions to Greenland, aiding in a melt event across Greenland's ice sheet which occurred much earlier than usual. Map by NOAA Climate.gov and Fiona Martin based on data from NCEP/NCAR Reanalysis data.
Temperatures in Greenland’s capital, Nuuk, reached 62° on April 11. Farther north and farther inland, Kangerlussuaq reached 64°F! Observations near Kangerlussuaq but higher up on the ice sheet (~6,000 feet above sea level) even recorded above-freezing temperatures, 37.6°F (3.1°C). An observation at the summit of Greenland, specifically at the Summit Research Station, set a new April record when temperatures rose to 20°F (-6.6°C). Scientists at the Danish Meteorological Institute (DMI) said that conditions were more typical of summer than the beginning of April.
Scientists at DMI consider the start of each year’s melt season to be the first time that 10% of the ice sheet surface area shows signs of melting. Melt is estimated by DMI using a model that includes weather forecasts and observational data. On April 11, this model estimated 12% of the Greenland ice sheet had melted at least 1 millimeter. This was the earliest melt onset on record by the DMI definition. The previous record was May 5, which happened in 2010. That makes 2016 three weeks earlier than the previous record!
Scientists here in the United States at the National Snow and Ice Data Center (NSIDC) use satellites to determine how much melt took place. These also noted an unusual melt spike in early April–10% of the ice sheet melted on April 11–well before ice melt is usually detected by satellites. While this year did not set a record for earliest 10% of melt across the ice sheet – a similarly sized event took place April 6-9, 2012 – it was amongst the earliest on record. (According to the DMI’s model-based estimate, the melt extent in April 2012 fell just shy of the 10% threshold required to qualify as the start of the melt season).
Climate change?
While these omega-block atmospheric patterns occur naturally, bringing warmer than average air to the Arctic, there is no doubt that these patterns are occurring in a world warmed by climate change. And there is no place on earth that is warming as fast as the Arctic.
In 2015, according to NOAA’s Arctic Report card, melt area across Greenland’s ice sheet exceeded 50% on July 4, the first time that had happened since July 2012. For western, northwestern and northeastern regions, the melt season lasted up to 30-40 days longer than normal. The end result last year was the loss of 186 gigatons of ice mass over the entire ice sheet. Since 2002, Greenland's ice sheet has lost over 3,000 gigatons of ice mass.
Environments already stressed by climate change can be pushed to more extremes by natural atmospheric patterns. January through March of 2016 was the most anomalously warm start to a year on record and the highest departure from average for any three-month period on record. This record-warm winter/spring was then capped by an atmospheric pattern that sent the mercury soaring to temperatures more often associated with the summer.
All these influences together may have contributed to the surprisingly early ice sheet melt in Greenland in April.