Top 10 U.S. climate & weather events of 2011
According to NOAA scientists, 2011 was a record-breaking year for climate extremes, as much of the United States faced historic levels of heat, rain or snow, flooding, and severe weather. As part of its annual review of Earth‘s climate, NOAA scientists and other experts from around the country identified and ranked the year‘s most significant national climate or weather events. The voters consider factors such as the scope and unusualness of the event, its immediate human and economic impact, and whether it is emblematic of climate trends or variability. These images showcase the events that will go down in NOAA‘s record books as 2011‘s most significant climate or weather events.
Tornado Super Outbreak, April 25-28
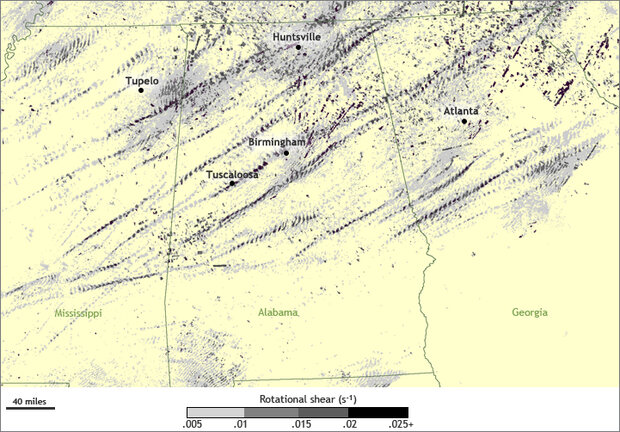
On April 25-28, the largest tornado outbreak ever recorded (343) leveled the U.S. Southeast. April 27 set modern-day records for most tornados (199) and tornado-linked deaths (318) in a 24-hour period. Tire-track lines across the map above (original post) show where radars detected vorticity—a likely sign of a passing tornado. More information: Spring Extremes Special Report.
Extreme Southern Drought, throughout 2011
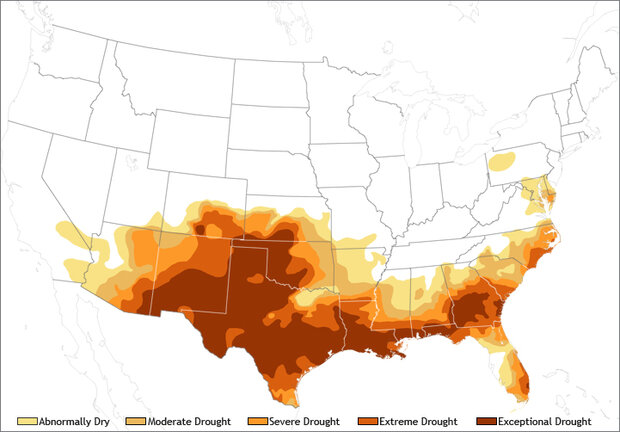
Extreme, persistent heat, and scant precipitation defined the most "intense" one-year drought on record for large portions of the Southern Rockies, Southern Plains, and Louisiana. Calendar year 2011 was Texas‘ driest on record. The map shows drought conditions for the week ending July 12, when the area experiencing drought broke a U.S. record. More information: Spring Extremes Special Report.
F5 Tornado, Joplin, Missouri, May 22
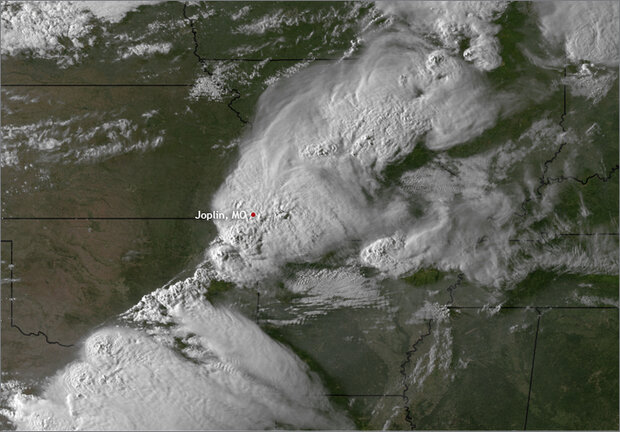
An E-F5 tornado tracked through the heart of Joplin, Missouri, claiming 158 lives. It was the deadliest tornado since 1947 and the seventh deadliest in U.S. history. It was also the costliest single tornado in U.S. history. The satellite view above shows the storm that spawned the tornado passing over the Great Plains on May 22. More information: Spring Extremes Special Report
Historic Flooding on the Ohio & Mississippi Rivers, May
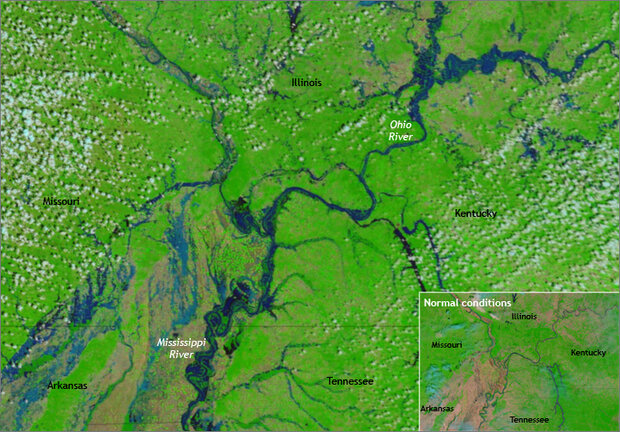
Much of the central U.S. received up to three times their normal spring rainfall, and four Ohio River states (KY, OH, PA, and WV) had their wettest spring on record. Record and near-record flood stages occurred throughout the lower Mississippi and Ohio River systems, many exceeding the legendary floods of 1927 and 1937. The infrared-enhanced satellite image above shows the extent of flooding on April 29, compared to the normal conditions (inset). More information: Spring Extremes Special Report
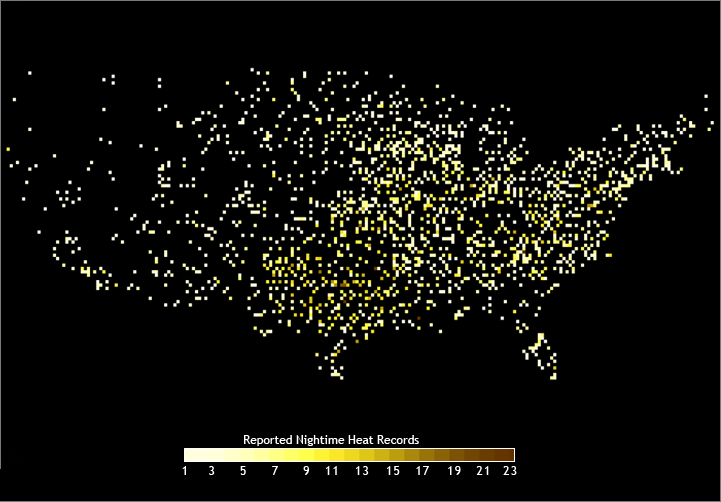
Record Summer Heat, June-August

Texas, Oklahoma, New Mexico, and Louisiana had their warmest summer on record. Statewide temperature in Oklahoma and Texas both exceeded the record for the two warmest summers for any state in the Union. The colored dots on the map show the number of times between June and August that the overnight low temperature—the coolest time of the day—broke the daily record at that location. More information: Summer National Report
Hurricane Irene, August 20-29
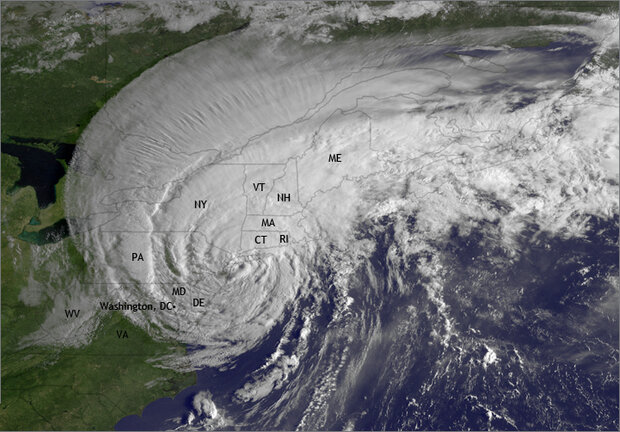
The first U.S. landfalling hurricane since 2008, Irene made 3 landfalls along the Atlantic coast, disrupting power to more than 7 million homes and business and spawning numerous tornados. Irene caused at least 45 deaths and more than 7.3 million in damages. In the satellite image above, Irene is making landfall in New York on August 28. More information: August Tropical Cyclones Report
Northern Plains & Missouri River Floods, June
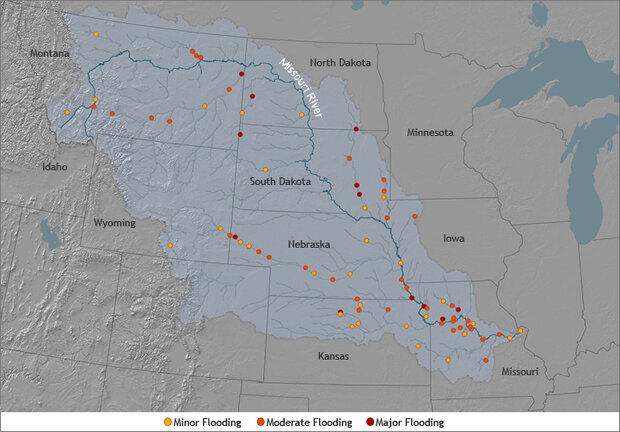
Meltwater from an above-average winter snowpack made its way into the rivers and streams of the Missouri River system in summer 2011. Combined with warm spring temperatures and above-average spring precipitation, the snowmelt led to record flooding across the Northern Plains and Upper Midwest. The map (original post) shows a snapshot of gauges reporting flooding on May 26. More information: Spring Extremes Special Report
South & Southwest Wildfire Season, Spring-Fall
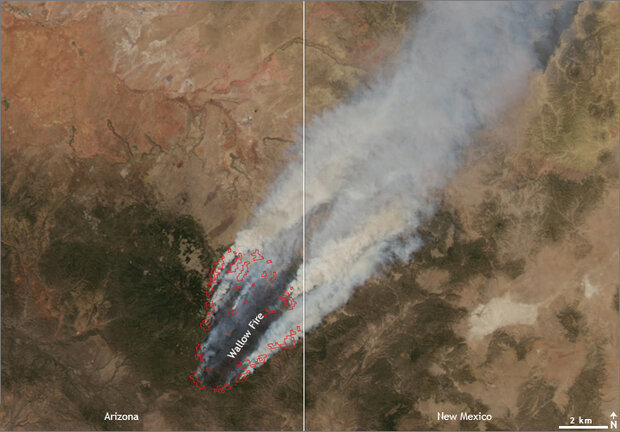
The spring-fall wildfire season across the southern U.S. broke numerous records. Texas had its most destructive fire—destroying over 1,500 homes—while Arizona and New Mexico had their largest blazes on record. The satellite image above shows smoke billowing from the half-million-acre Wallow Fire in Arizona on June 8. More information: Spring Extremes Special Report
Southern Tornado Outbreak, April 14-16
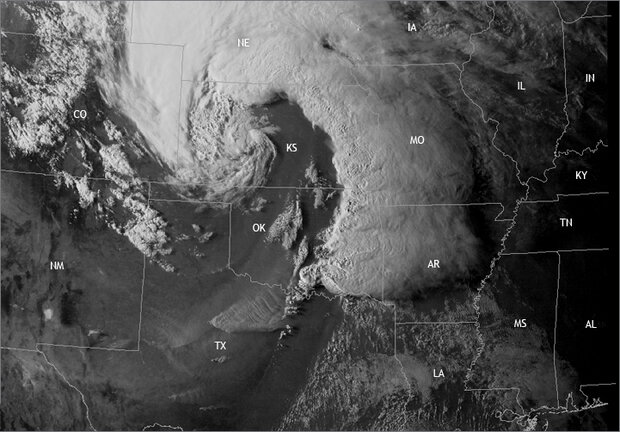
The outbreak spanned a region from Oklahoma to North Carolina, and at the time, it was the largest tornado outbreak on record, being surpassed just two weeks later. Thirty tornadoes were verified in North Carolina, breaking the state daily record. The satellite view above (original post) shows the immense storm system on April 14. More information: Spring Extremes Special Report
Tropical Storm Lee, September 1-11
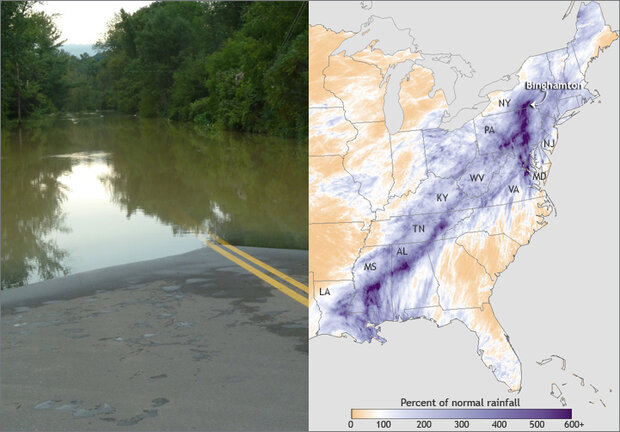
Lee made landfall on the parched Gulf Coast, where impacts were major, and mixed (drought relief, but with severe local flooding). The slow churn of the remnants across the already soaked Ohio Valley and Northeast brought continued misery the region, and floods of historic proportions to Binghamton, NY, and Hershey, PA. The pair of images above shows street flooding near Binghamton (left) and the percent of normal rainfall in the eastern United States in the first two weeks of September (right). More information: September Tropical Cyclones Report