El Niño and U.S. winter weather
Details
According to NOAA’s Climate Prediction Center, weak El Niño conditions may develop this fall. How might a full-fledged El Niño event this winter influence weather where you live?
Years of monitoring and studying El Niño and La Niña events have helped scientists better understand how these seesawing warm and cool cycles in the tropical Pacific typically influence climate and weather patterns throughout the United States. This information can be particularly useful to farmers and water managers.
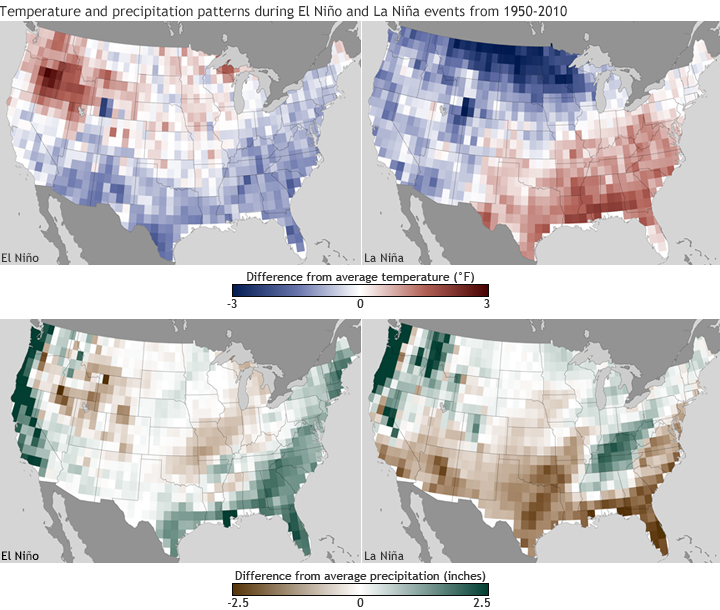
El Niño and La Niña are particularly influential in the winter. These maps show the difference from average December-February temperature and precipitation averaged over 22 El Niño and 19 La Niña episodes that have occurred in the past 60 years.
In the top row, shades of red indicate areas that were up to 3 degrees Fahrenheit warmer than average while shades of blue indicate areas that were up to 3 degrees cooler than average. In the bottom row, shades of brown indicate areas that received up to 2.5 inches less than average precipitation while green indicates up to 2.5 inches more than average.
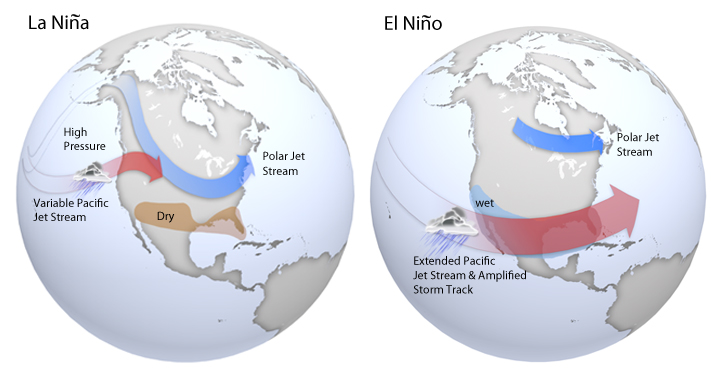
During El Niño events, the easterly trade winds that blow across the tropical Pacific Ocean are weaker than usual and sea surface temperatures in the central and eastern Pacific become warmer than usual. An outcome of warmer waters is increased thunderstorms in the eastern tropical Pacific, contributing at times to well above normal precipitation on the West Coast. El Niño events also increase the odds of unusually wet and cold winters across the southern tier of the United States, while the Pacific Northwest tends to experience milder winter temperatures than usual.
During La Niña events, the pattern is typically reversed. Sea-surface temperatures in the eastern tropical Pacific are cooler than normal. The polar jet stream tends to shift northward over the central Pacific Ocean, increasing the likelihood of wetter- (or snowier-) than-normal winters in the Pacific Northwest and colder temperatures in much of the western half of the country. The meandering jet stream also typically leads to dry conditions and above-average temperatures in the southern tier of the country.
Maps based on data provided by Michelle L’Heureux, NOAA Climate Prediction Center.
Links
Climate Prediction Center’s El Niño-Southern Oscillation Page