Climate change to increase water stress in many parts of U.S.
Details
Nearly ten percent of U.S. watersheds are living beyond their means when it comes to their water supply. For nearly half the country, water stress is projected to worsen by mid-century because of climate change, according to a recent NOAA-funded analysis.
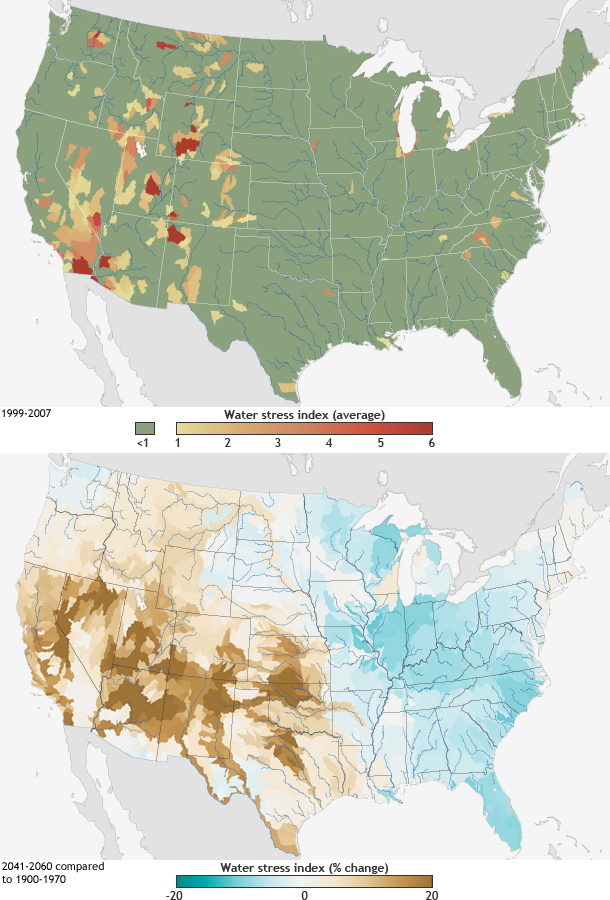
The top map shows the average ratio of demand to supply for roughly 2,000 watersheds between 1999-2007. Index values equal to or less than 1 (green) mean supply equaled or exceeded demand on average. Values above 1 (yellow to red) mean water stress: demand exceeded supply, in cases by more than 5 or 6 times.
The bottom map shows percent change in the water stress index by mid-century (2040-2061) compared to historic averages (1900-1970). Blues show where climate change is likely to increase surface water supply (more rain). Browns mean global warming and its precipitation side effects are projected to decrease supply, making water stress worse. In many places, the two maps converge; already stressed watersheds face even greater stress.
As part of the analysis, scientists figured out where the water was going: agriculture, municipal use, or cooling for power plants. In the majority of places with water stress, the largest water demands come from agriculture, but in a few places—notably Southern California and Las Vegas—the major demand is municipal water needs. Scattered throughout the Upper Midwest and Southeast, a few watersheds experience stress due to the large amount of water needed for cooling at power plants.
The researchers suggested that if policy makers and planners wanted to know how resilient their watersheds might be in the face of climate change, they could start by assessing how well they balanced supply and demand on average, as well as during the worst (driest) years of the recent past. An alternate map shows the highest water stress index value each watershed experienced between 1999 and 2007.
In writing about their results, the scientists pointed out that their analysis is a starting point for understanding watershed vulnerability, but not the whole picture. For one thing, groundwater was included in the "supply" side of the equation and was assumed to be limitless, even though it isn't truly so. Places that rely heavily on aquifers, such as the farming belt of the Great Plains, may be under greater stress than the top map indicates if their groundwater consumption is unsustainably high.
In addition, the analysis only focused on future changes in the "supply" side of the equation, not demand. That means it didn't account for population growth, which would increase demand if water use rates stay constant. But it also didn't account for any changes we could make to conserve water in households, power plants, or agricultural activities, which would reduce demand.
Few things are more important to human quality of life than easy access to clean water. Understanding how stressed U.S. watersheds have been in the recent past and how they will fare in the future is a critically important part of NOAA's efforts to help America become more resilient to extreme events and to human-caused climate change.
References:
K Averyt, J Meldrum, P Caldwell, G Sun, S McNulty, A Huber-Lee, and N Madden. 2013. Sectoral contributions to surface water stress in the coterminous United States. Environmental Research Letters 8: 035046 (9pp). doi:10.1088/1748-9326/8/3/035046
Links
Western Water Assessment