Arctic sea ice extent at 2018 winter maximum was second smallest on record
Details
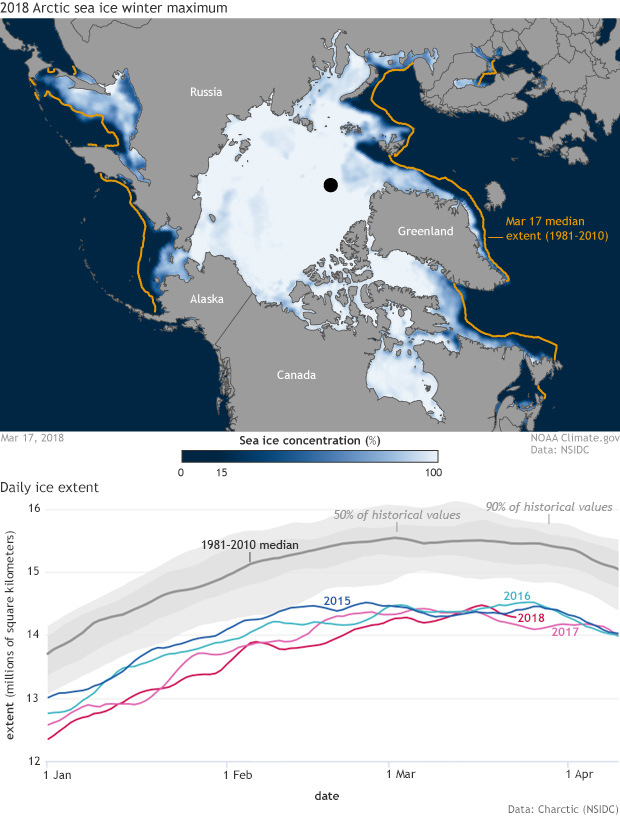
Arctic sea ice reached its likely 2018 maximum on March 17, the National Snow and Ice Data Center (NSIDC) reported. On March 23, NSIDC released a summary of the sea ice maximum: 14.48 million square kilometers (5.59 million square miles). It was the second-lowest seasonal maximum in the 39-year satellite record, only slightly below the maximum extent for 2017.
The map at right shows sea ice concentration on March 17 compared to the median extent between 1981-2010 (gold line). Land is gray, ocean is navy blue, and sea ice appears in shades of white (higher sea ice concentration) and blue (lower concentration). Ice cover was sparse at lower latitudes on both sides of the Arctic. Directly over the North Pole is a spot of missing data (black circle) that exists because the satellites’ orbits carry them just shy of the actual pole.
The graph shows daily sea ice extent (ocean area with at least 15 percent sea ice concentration) for the four most recent years compared to the 1981–2010 median and the range of historical values (gray shading). The four smallest wintertime ice extents have all occurred in the last four years, and they are all well outside the range of historical values. Extents for 2015 and 2016 are statistically tied for third-lowest. (NSIDC provides a breakdown of the lowest 10 wintertime maximum extents, all of which have occurred since 2005.)
Following the 2017 summer minimum, on September 13, 2017, Arctic sea ice extent remained well below the 1981–2010 median through fall and early winter. The new year started with the lowest sea ice extent on record, but extents increased enough in mid-January, early February, and mid-March to surpass 2017 and avoid setting a new record low.
The exact ranking of any single year, however, is less significant than the big picture changes evident across the Arctic. Summertime ice extent has not been above average since 2001. This fourth consecutive year of unusually low wintertime ice extent occurred against a backdrop of unusually high temperatures in the Arctic. Moreover, the low wintertime ice cover continues a longer trend of declining sea ice, particularly a decline in thick, multiyear ice, which is ice that survives more than one melt season.
NSIDC scientists, who have followed sea ice trends since the 1990s, expressed concern over long-term retreat. NSIDC director Mark Serreze said, “The Arctic is being hit in both winter and summer—climate change is really taking hold now.”
Senior research scientist Ted Scambos added, “The pace of change in the Arctic is just amazing. Every five years we see more of the ice slip away, and those years become the new record-holders.”
Reference
Arctic Sea Ice News and Analysis. (2018, March 23). National Snow and Ice Data Center. Accessed March 25, 2018.