Sea ice melts in the spring and summer, and grows in the autumn and winter. Arctic sea ice typically reaches its maximum extent sometime between late February and early April, and since the start of the twenty-first century, those winter maximums have declined. Although Arctic sea ice in 2018 hasn’t broken all previous records for its low wintertime extent, it is still trending well below the 1981–2010 average. But as researchers watched Arctic sea ice in early 2018, they marveled at the high air temperatures over parts of the Arctic. In late February 2018, at Cape Morris Jesup, Greenland, the weather station closest to the North Pole (maintained by the Danish Meteorological Institute), temperatures climbed 45°F above normal for that time of year.
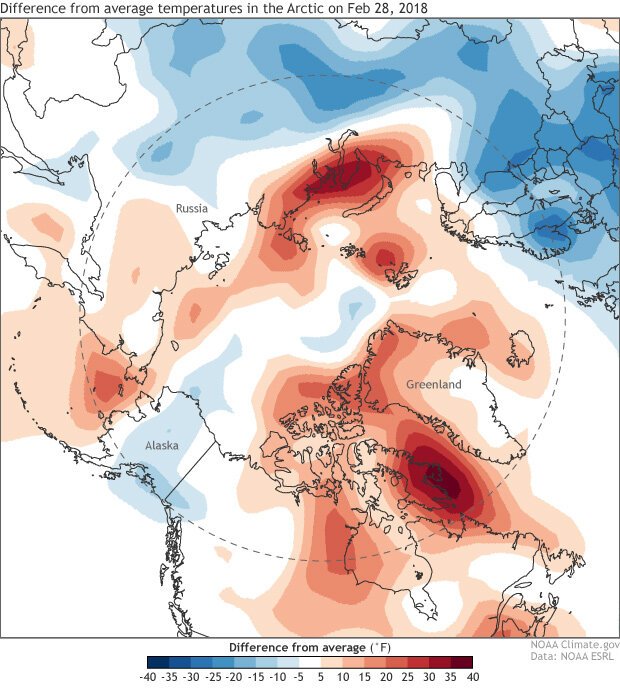
Unusually warm areas are red and unusually cold areas are blue.
Dramatic temperature anomalies can strike anywhere on Earth in any season, but 2018 was the third year in a row to bring anomalously warm temperatures over the Arctic Ocean. At the Cape Morris Jesup weather station, temperatures were above freezing for a total of 61 hours in the month of February, and remained above freezing for almost 24 hours. At their highest, they rose to 43°F. That's still fairly chilly, but to put this temperature spike in perspective, imagine the city where you live. At the end of February, the normal daytime maximum temperature in Washington, D.C.; Denver, Colorado; Boise, Idaho; and Louisville, Kentucky is roughly 50°F. Imagine all those cities sweating through a 95°F daytime maximum before March. Now imagine Miami at 124°F at the same time of year. See the table below for normal maximum temperatures for selected U.S. cities on February 28.
| City | Normal max (°F) | +45°F | City | Normal max (°F) | +45°F |
|---|---|---|---|---|---|
| Washington, DC | 50.5 | 95.5 | AL: Birmingham | 62.1 | 107.1 |
| AZ: Phoenix | 73.1 | 118.1 | AR: Little Rock | 58.8 | 103.8 |
| CA: Los Angeles | 67.5 | 112.5 | CA: San Fran. | 61.0 | 106.0 |
| CO: Denver | 49.5 | 94.5 | FL: Miami | 79.1 | 124.1 |
| GA: Atlanta | 61.3 | 106.3 | ID: Boise | 49.6 | 94.6 |
| IL: Chicago | 40.0 | 85.0 | IN: Indianapolis | 44.9 | 89.9 |
| IA: Des Moines | 41.3 | 86.3 | KS: Wichita | 52.4 | 97.4 |
| KY: Louisville | 49.7 | 94.7 | LA: New Orleans | 68.3 | 113.3 |
| ME: Portland | 37.6 | 82.6 | MA: Boston | 41.3 | 86.3 |
| MI: Detroit | 39.1 | 84.1 | MN: Minneapolis | 33.6 | 78.6 |
| MS: Jackson | 64.0 | 109.0 | MO: St. Louis | 48.7 | 93.7 |
| MT: Billings | 43.8 | 88.8 | NE: Omaha | 45.0 | 90.0 |
| NV: Las Vegas | 61.3 | 106.3 | NM: Albuquerque | 56.2 | 101.2 |
| NY: New York City | 42.5 | 87.5 | NC: Raleigh | 55.9 | 100.9 |
| ND: Bismarck | 32.6 | 77.6 | OH: Cincinnati | 46.9 | 91.9 |
| OK: Oklahoma City | 58.4 | 103.4 | OR: Portland | 52.5 | 97.5 |
| PA: Philadelphia | 43.5 | 88.5 | SC: Charleston | 65.7 | 110.7 |
| SD: Rapid City | 42.7 | 87.7 | TN: Memphis | 58.7 | 103.7 |
| TX: Dallas | 63.4 | 108.4 | TX: Houston | 69.1 | 114.1 |
| UT: Salt Lake City | 48.3 | 93.3 | VT: Burlington | 34.1 | 79.1 |
| WA: Seattle | 51.2 | 96.2 | WV: Charleston | 46.4 | 91.4 |
| WI: Milwaukee | 35.8 | 80.8 | WY: Cheyenne | 43.4 | 88.4 |
| Data source: http://sercc.com/nowdata.html | |||||
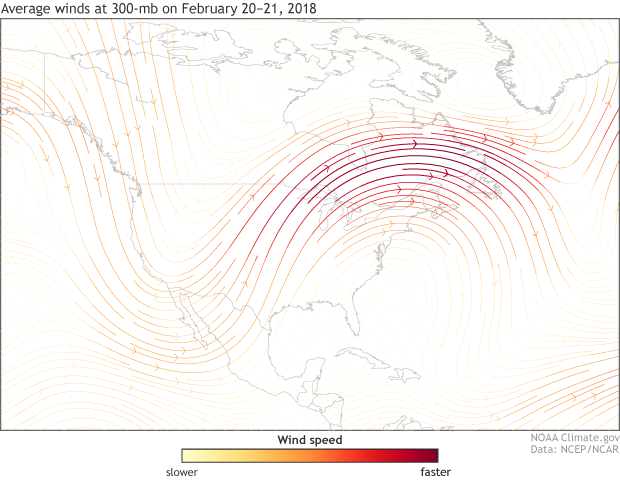
Bear in mind that, although parts of the Arctic were unusually warm in late February, other areas (parts of Alaska, Greenland, Canada, and the Arctic Ocean) were unusually cold. And while the North Pole experienced unusual warmth, much of Europe shivered through a deep freeze, with snowfall in Rome. This mix of unusual heat and cold comes down to the jet stream.
A strong difference in atmospheric temperature between the lower and higher latitudes causes the air current known as the Northern Hemisphere’s polar jet stream to flow between the Arctic and the middle latitudes. Sometimes the difference in atmospheric pressure at different latitudes lessens, making the jet stream wavier. Warm air infiltrates the Arctic, and cold air infiltrates lower latitudes. That’s what happened in late February. Some studies indicate that Arctic sea ice decline increases jet stream waviness by allowing greater heat transport from the ocean to the atmosphere, but National Snow and Ice Data Center Director Mark Serreze says that this hypothesis remains a topic of "fierce debate."
References
Arctic Sea Ice News and Analysis. (2018, March 6). A warm approach to the equinox. National Snow and Ice Data Center. Accessed March 18, 2018.
Irfan, Umair. (2018, February 28). The North Pole just had an extreme heat wave for the 3rd winter in a row. Vox. Accessed March 18, 2018.