2013 Arctic Report Card: Atmospheric Soot Decreasing Over High Arctic
Details
Black carbon, also known as soot, emitted from combustion of fuels and biomass burning, ‘darkens’ the Arctic’s snow and ice, adding to the ongoing surface warming due to greenhouse gas emissions. Since the early 1990s, annual atmospheric equivalent black carbon concentrations in the Arctic have decreased at the surface by as much as 55 percent—one of the few "good news" stories coming out of the region.
In addition to natural phenomenon like wildfires—which are increasing in number and severity on the North Slope of Alaska—various industrial activities like agricultural burning, deforestation, gas flaring and diesel vehicles are some of the largest sources of black carbon emissions. Historically, atmospheric black carbon in the high Arctic originated from the former Soviet Union, Europe, North America and East Asia.
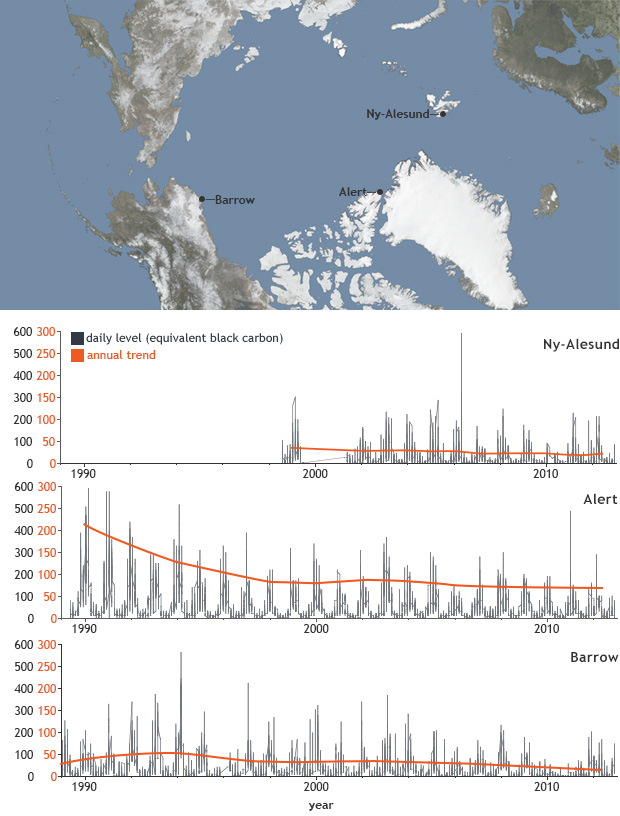
The map shows the locations of three black carbon measurement sites: Alert (Nunavut, Canada); Barrow (Alaska, USA); and Ny-Ålesund (Svalbard, Norway). Alert and Barrow have the longest measurement records, from 1989 through the present, while the Ny-Ålesund record goes back only as far as 2002. The graph depicts the annual trends (orange line) in daily average surface ‘equivalent black carbon (EBC),’ which is calculated using change in light attenuation measurements collected at each of the observation sites.
The peaks and valleys of the daily data represent the seasonal maximums and minimums. The highest spikes occur during the winter when the polar front dips south towards the mid-latitudes, whisking up pollution and dragging it back towards the Arctic. In the springtime, the accumulation of black carbon and other air pollutants contribute to a visible reddish-brown “Arctic haze” commonly observed in the high latitudes.
Between 1990-1993 and 2009-2012, observation sites recorded a 55 percent decline in EBC at Alert and a 45 percent decline at Barrow. The declines are related to the economic collapse of the former Soviet Union during the early 1990s. At all three Arctic sites, EBC has not increased since 2000 despite rising global black carbon emissions—particularly in the developing nations of East Asia. How can that be?
When black carbon is injected into the atmosphere over East Asia, wind currents transport it at higher altitudes than black carbon from former Soviet Union and Europe. The soot is then transported over open ocean where a large amount of particles get washed out en route to the Arctic. This prevents soot from being deposited on the Arctic’s icy surfaces, although it remains in the atmosphere absorbing heat for several days or weeks.
The bright white surfaces of snow and ice reflect well over half of the sunlight that falls on it. Darkened, soot-covered snow or ice absorbs more sunlight, leading to surface warming and accelerating melting. It is in part due to the effects of black carbon on all the snow and ice in the Arctic that temperatures in this region have warmed twice as fast as in the mid-latitudes—a process called “Arctic amplification.”
More information can be found in the Black Carbon in the Arctic chapter of the Arctic Report Card: Update for 2013.
Map by NOAA Climate.gov, based on equivalent black carbon data provided by Sangeeta Sharma, Environment Canada.
Related Links