
Image caption
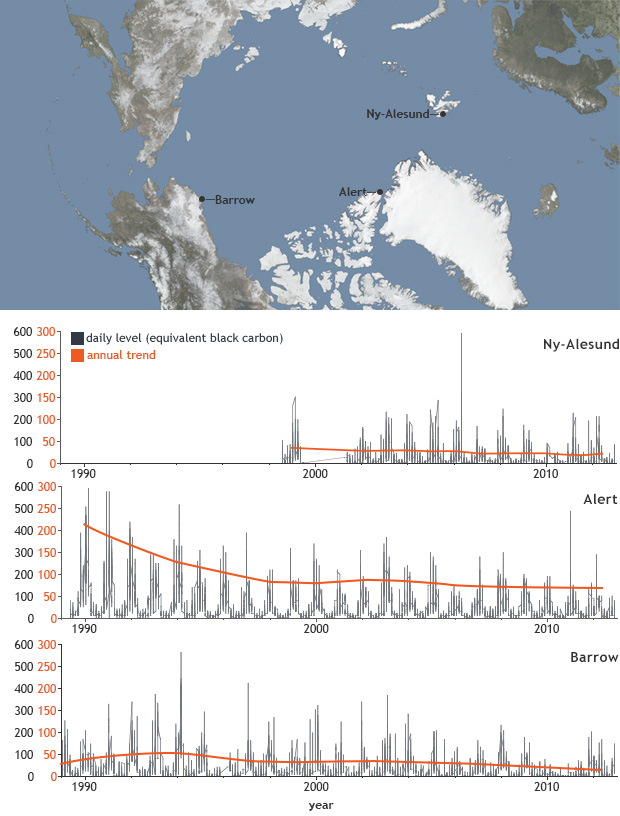
Map of Arctic black carbon monitoring stations and graphs of daily observations from each (gray bars) as well as the long term trend (orange line). Image by NOAA Climate.gov, based on data provided by Sangeeta Sharma, Environment Canada.