With rising greenhouse gases, U.S. heat waves to become more common & longer-lasting
Heat waves like the one that punished the central United States in July 2012 may be more common and longer-lasting by the time today’s children are raising their own families, according to results from a high-resolution climate model experiment conducted by scientists at NOAA’s Geophysical Fluid Dynamics Laboratory.
In the experiment, greenhouse gas emissions in the coming century were assumed to follow a trajectory that climate modelers refer to as the A1B scenario, in which global economic growth is rapid and driven by a balanced portfolio of energy sources, including fossil fuels, renewables, and nuclear.
The model projected that within the next 30-60 years, the number of days U.S. heat waves last will have increased by a factor of 1.2 to nearly 2 times in comparison to similar events occurring between 1970-2000. The largest increases were projected for the West and parts of the Gulf Coast (dark reds). In other words, a Texas heat wave that would have lasted a week in the 1980s might last nearly two in the 2050s.
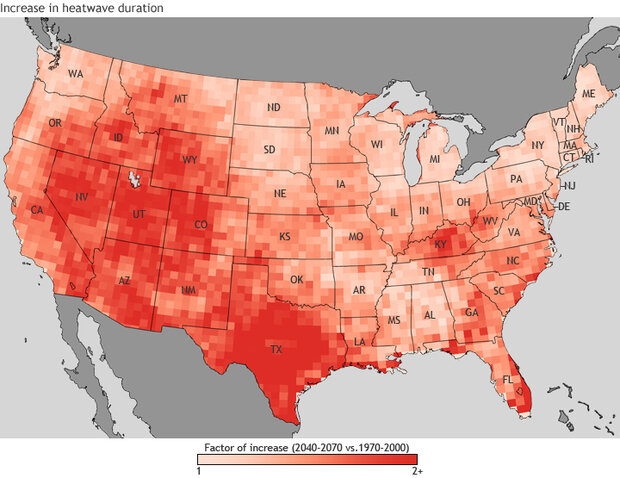
Map showing ratio of modeled heatwave duration (days) in the mid-21st century compared to the end of the 20th century. NOAA Climate.gov map by Dan Pisut and Richard Rivera, based on data provided by Mary Jo Nath and Gabriel Lau.
A large splash of dark orange across the states of Montana, Wyoming, and North and South Dakota indicate that the number of heat waves there may nearly quadruple compared to the end of the last century. Other large increases were projected for the Southern Rockies, as well as parts of the Mississippi Valley and Florida.
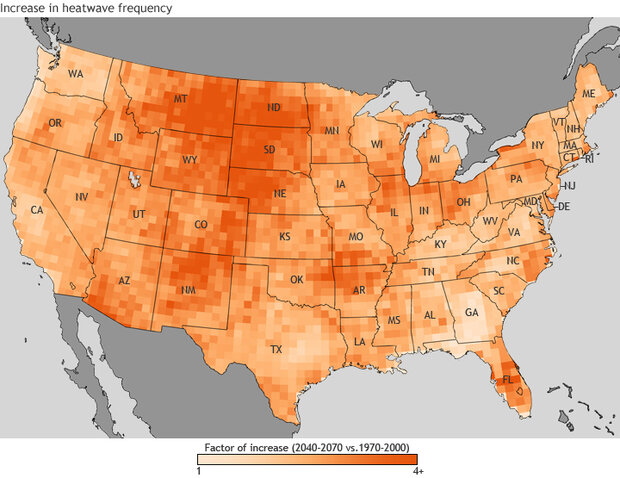
Map showing ratio of modeled heatwave frequency (episodes per summer) in the mid-21st century compared to the end of the 20th century. NOAA Climate.gov map by Dan Pisut and Richard Rivera, based on data provided by Mary Jo Nath and Gabriel Lau.
When the two characteristics of extreme heat (duration and frequency) were combined, the number of heat wave days per summer was projected to increase by four- to five-fold in many western mountain states and Texas (red-orange).
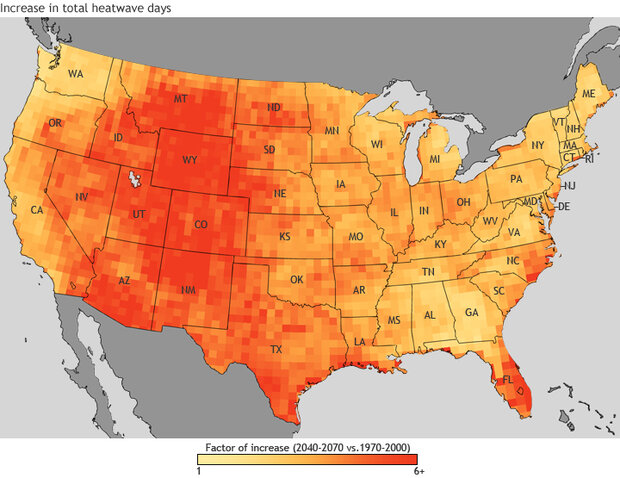
Map showing ratio of total heatwave days per summer (frequency times duration) in the mid-21st century compared to the end of the 20th century. NOAA Climate.gov map by Dan Pisut and Richard Rivera, based on data provided by Mary Jo Nath and Gabriel Lau.
When the scientists analyzed the model-simulated weather patterns that typically accompany heat waves in the Northern Plains, they looked a lot like the one that happened this July: a jet stream shifted far north of its normal position and an obstinate, upper-level high-pressure dome parked over the center of the North American continent.
That the model recreated many of the weather patterns that have been observed in actual heat waves in various parts of the country lends additional credibility to the projections, says Gabriel Lau of NOAA’s Geophysical Fluid Dynamics Laboratory, the lead scientist on the analysis of this experiment.
But that doesn’t mean he understands everything about the model results. Why does the model think the Northern Plains will see a bigger increase in heat waves than similar latitudes in the Northeast? Why is Florida’s projected future so different from Georgia’s?
The answers will depend on which factors—such as atmospheric flow, rainfall anomalies, condition of the ground surface, or sea surface temperature—are more likely to cause heat waves in specific regions. One of the ways to gain more understanding, Lau says, is to examine the results of “coupled” high-resolution models, which are running on supercomputers right now.
In the models that generated the maps featured above, the atmosphere is allowed to respond freely to pre-set changes in the ocean or land surface that the scientists specify in the course of the simulation, but the ocean can’t adapt to atmospheric changes in response.
In a “coupled” model, however, there is two-way communication. The ocean is allowed to change in response to changes in the overlying atmosphere—more like the real climate operates.
If coupled models are more like the real climate system, why don’t scientists just use them all the time? Because, explains Lau, allowing two-way communication vastly multiplies the complexity and number of calculations the computer has to perform, and the higher the resolution (detail), the bigger the challenge. Few computers can meet the demands that high-resolution, coupled models place on processing speed and working memory.
References & Links
Lau, N.-C. & Nath, M. J. (2012). A Model Study of Heat Waves over North America: Meteorological Aspects and Projections for the Twenty-First Century. Journal of Climate, 25, 4761–4784.
Research Highlights Summary from Geophysical Fluid Dynamics Laboratory
Global Temperature Projections
100° days: Past and Future
Reviewed by Gabriel Lau, NOAA Geophysical Fluid Dynamics Laboratory.
![]()