What is predictability?
This is a guest blog by Michael Tippett (professor at Columbia University) and Tim DelSole (professor at George Mason University), adapted from material in their new text book Statistical Methods for Climate Scientists.
Predictability is a word that often comes up in discussions here on the ENSO Blog (another is variability). Let’s see if we can understand what climate scientists mean by predictability without having to read an entire book on statistics! As you might guess, climate scientists use the word predictability a little differently than the rest of the world. For instance, you might say that I am predictable because I take the same path each day on my morning walk, with small variations. On the other hand, for a climate scientist concerned with predictability, the question is whether it’s possible to forecast how my walk tomorrow will differ from its usual path (footnote #1).
Predicting that I’ll take my usual path is a climatological forecast in the sense that it is based only on the long-term average (climate) of past events. For a climate scientist, predictability is all about how forecasts differ from the climatological forecast. In fact, if the climatological forecast of an event is the only forecast available, the climate scientist will say that the event is unpredictable. So, my morning walk could be predictable to you but unpredictable to a climate scientist.
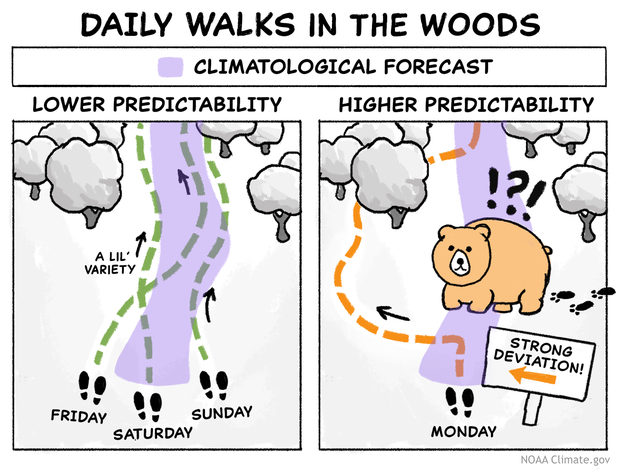
(left) If the only forecast we can make for a hiker's path through the woods on a given day is that it will be similar to the long-term average, we call that outcome unpredictable. (right) If we can forecast occasions when a hiker's path will deviate from the climatological path, we say the future path has some level of predictability. NOAA Climate.gov cartoon.
Note that, according to the climate scientist, forecasts of the sun rising tomorrow, nighttime being dark, winter being colder than summer, etc., get no credit in terms of predictability because they are climatological forecasts.
Flip a coin
Let’s consider an example of predictability we can agree on. I would say the outcome of a coin toss is unpredictable, assuming a fair coin, and no funny business on the part of the person tossing the coin. Why do I say it is unpredictable? Is it because the outcome is random and cannot be predicted? No, I can make a forecast of 50% chance of heads, and that is a perfectly fine (footnote #2a) and reliable forecast (footnote #2b). Is it because that forecast uses probabilities? Also no—weather and climate forecasts often use probabilities.
The reason I say the coin toss is unpredictable is because the 50/50 forecast is a climatological forecast. It does not tell us anything about this coin toss that is different from any other coin toss. In fact, a tell-tale sign for unpredictability is if our 50/50 forecast doesn’t change from one coin toss to another.
How can the coin toss help us to understand anything about the unpredictability of weather? Imagine I’m planning a 4th of July picnic, and I want to know whether or not it will rain here in Nyack, NY. Is that something that I can predict now in April? I’d say no. It’s unpredictable—the chaotic nature of the atmosphere means making a precise weather forecast two months ahead of time is essentially impossible. However, I do know that rain has been observed on 33% of past July 4ths during the period 1991–2020, so I can make a climatological forecast of a 33% chance of rain for my picnic. Since it’s a climatological forecast, it does not tell us anything new about 4th of July weather this year, and it doesn’t change from one year to another—the hallmark of unpredictability (footnote #3).
Does this mean that a climatological forecast is not useful? No, even for picnic planning a 33% chance tells me that I need to have an indoor backup plan, since rain is not uncommon. Moreover, the climatological forecast (or, more generally, the range of possible outcomes) is invaluable for long-term planning. Which crops as well as where and when to plant them, how much to charge for home insurance in hurricane-prone Florida, how high should the levees be in New Orleans, when should Walmart stock snow-pants—all these questions are answered by climatological forecasts.
Flip a coin—but this time, watch carefully
But wait, the coin toss has more to tell us about predictability. While its outcome under normal circumstances is unpredictable, the outcome is certainly more predictable if I use a high-speed camera to accurately capture the coin’s initial position and speed and then use the laws of physics to compute its trajectory. Good observations and science can increase predictability! The same is true about weather. If we know the state of the atmosphere today, we can use the laws of physics to predict its state in the future.
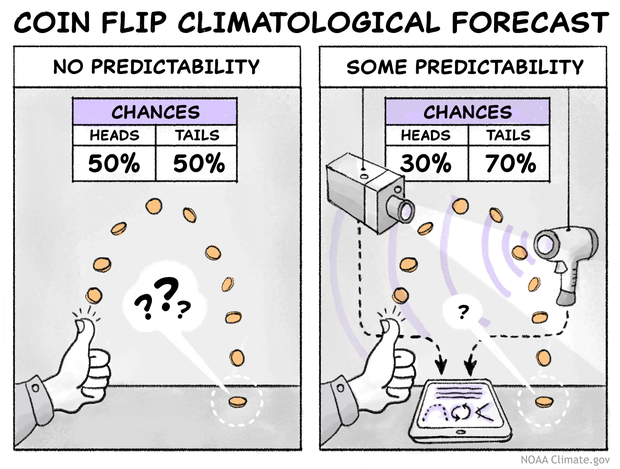
Under normal circumstances (left), a coin toss is unpredictable by climate standards—based on the long-term average, any single toss has a 50 percent chance of heads and a 50 percent chance of tails. Carefully measuring the coin's initial position and speed and then using the laws of physics to predict its trajectory can increase the predictability. NOAA Climate.gov cartoon.
But if that’s the case, why is weather hard to predict? First, the world is a big place and measuring the initial state of the atmosphere (winds, temperatures, pressure, etc.) everywhere on the planet is hard, if not impossible, and the measurements that we do have contain errors. Second, limits in computing power and physical understanding mean that forecasts are based on approximations of the exact laws of physics. Third, there’s chaos and the butterfly effect (not just a movie) where errors in our initial estimate of the atmospheric state today have a big impact on our forecasts of next week’s weather.
What does this mean for my 4th of July weather forecast? Will the physics-based computer model forecasts be completely out to lunch? Will they tell me to expect snow while grilling? No—predictability limitations mean that I expect the forecast made now for the 4th of July will contain the same information as in a climatological forecast (i.e., that 33% chance of rain). The computer model will start with detailed information about today’s atmospheric state, and as forecasts go further into the future, they will contain fewer and fewer details that are specific to this year, until eventually the 4th of July forecast is little better than (and hopefully no worse) than a climatological forecast.
Model behavior
You can see this behavior in forecasts from the Global Ensemble Forecast System (GEFS), a weather model used by NOAA. Shown are two forecasts of temperature for a location in Texas. The forecasts were made on April 1 of 1999 and 2019. Looking at forecasts of the same period in two different years shows what features in the forecast are the same (climatological) and what features are different (evidence of predictability). For the first week or so, forecasts from the two years are well-separated, indicating predictability. By the second week, they’re nearly indistinguishable (no predictability). The periodic ups and downs every 24 hours are the diurnal cycle (e.g., afternoons tend to be warmer than evenings), and the forecasts get no credit for that in terms of predictability. (footnote #4)
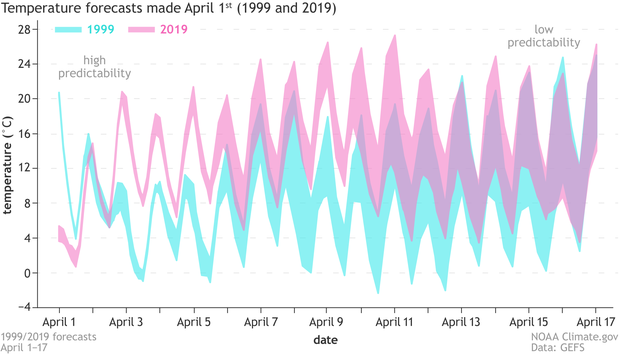
Forecasts of near-surface temperature by the Global Ensemble Forecast System (GEFS) at a particular location in Texas every six hours for April 1, 1999 (pink) and April 1, 2019 (blue). For each year, the models used 11 slightly different initial conditions to represent the uncertainty of the initial state and the subsequent range of forecast outcomes. The periodic oscillations every 24 hours reflect the day-night cycle (e.g., afternoons tend to be warmer than evenings). For reference, days 2 and 13 are indicated by thin vertical lines. Forecasts from the two years become harder to distinguish as time goes on, indicating a decrease in predictability. NOAA Climate.gov figure, adapted from original by Michael Tippett and Tim DelSole.
Notice that I’m using a computer model to say something about the predictability of nature, which is like using mice to say something about humans, which can be useful, but is not exactly the same. In any case, scientists do use physics-based computer models and ensemble forecasts to measure predictability and to study predictability in different locations, times of the year, ENSO phases, over different time ranges (daily, monthly, seasonal, etc.), and future climates.
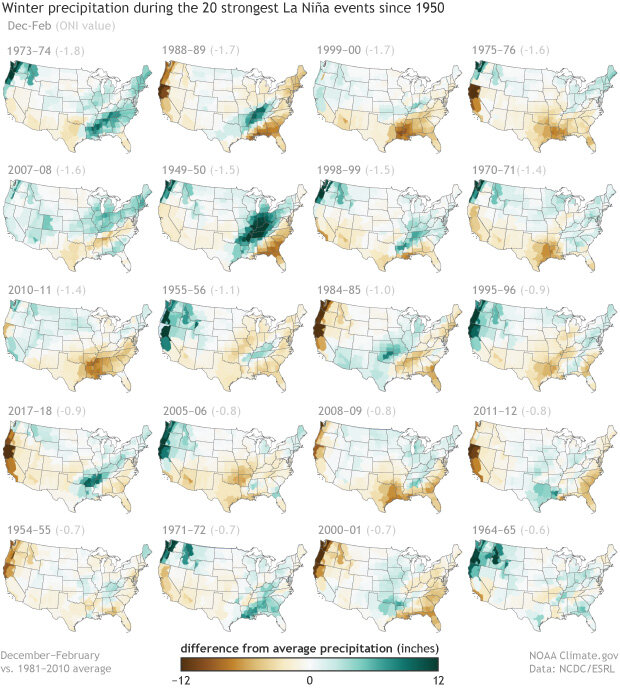
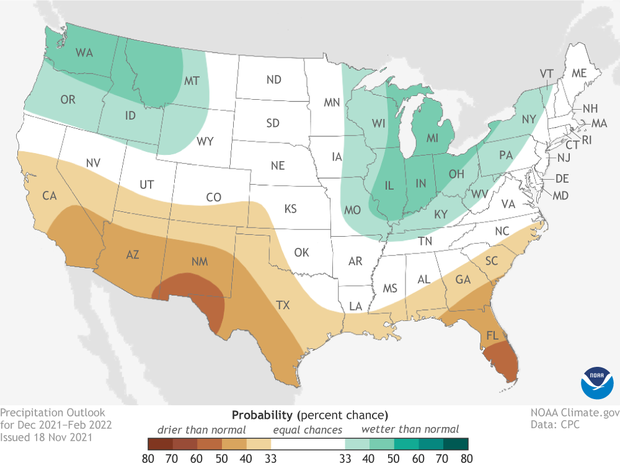
This (old) version of GEFS did not include a realistic ocean and therefore did not have ENSO. As readers of the ENSO blog are aware, the phase of ENSO can provide information about seasonal averages of temperature and precipitation (which is different from information about the weather on a particular day). For instance, looking at past La Niña winters shows how winter temperatures tend to differ from the climatology forecast. This fact plus the ability to predict the phase of ENSO in advance means that ENSO is a source of predictability. That is reflected in the CPC winter 2021–22 precipitation outlook which is similar to a typical La Niña pattern. (Note that when climate outlooks are framed in terms of above normal and below normal, the comparison with respect to the climatological forecast is built in.)
So, what can morning walks and coin tosses tell us about the climate perspective on predictability? Although handy for long range planning, climatological forecasts which are based on long-term averages or odds don’t change from year to another and don’t count toward predictability. A good combination of measurements (observations), the laws of physics, and computers can improve predictability of both coin tosses and weather forecasts. We can see the loss of predictability in physics-based computer model forecasts as specific initial conditions (a source of predictability in weather forecast) gradually fade into a climatological forecast. In climate forecasts, ENSO is a source of predictability, hilarity, and employment.
Lead Editor: Emily Becker, Cooperative Institute for Marine and Atmospheric Studies (CIMAS)
Footnotes
(1) The definition here of predictability is the one due to Edward N. Lorenz, where predictability is lost when a forecast is indistinguishable from a climatological one. This definition is also consistent with the statistical concept of independence and with information theory measures such as mutual information.
(2a) Although 50/50 is fine in practice, leave it to mathematicians to make it more complicated.
Diaconis, P., Holmes, S., & Montgomery, R. (2007). Dynamical Bias in the Coin Toss. SIAM review, 49(2), 211-235.
(2b) It is hard to say if a single probability forecast is correct or not. However, we can determine if a set of forecasts are well-calibrated or reliable. A set of forecasts are said to be reliable if the event predicted happens on average as often as predicted (the “on average” is why it is hard to say if a single probabilistic forecast was good or not). My forecasts are well calibrated if, for instance, it rains 70% of the time when I predict 70% chance of rain. Reliable forecasts mean what they say. https://projects.fivethirtyeight.com/checking-our-work/
(3) A climatological forecast is the same every year unless the climate is changing, in which case it might include those changes. If we know the climate is warming, do we get credit for predicting that trend? While information about trends is invaluable, it can be argued that in terms of predictability, the climate change signal should be included in the climatological forecast. So, credit in terms of utility, but not in terms of predictability. T. DelSole and M. K. Tippett, Predictability in a Changing Climate. Clim. Dyn., 51, 531-545, 2018. doi:10.1007/s00382-017-3939-8.
(4) Each year, 1999 and 2019, has 11 forecasts (an ensemble of forecasts) that start from 11 slightly different initial conditions to mimic uncertainty in the initial observations and to give a sense of the range of possible outcomes. Near the start on April 1, the forecast ensembles from each year are grouped tightly together. By April 14, the ensembles from each are more spread out, and by the end, forecasts from 1999 and 2019 are nearly indistinguishable, as we’d expect if the forecasts are heading toward a climatological forecast. Since everything else is the same, it’s reasonable to point to the initial conditions as being the source of predictability in the GEFS forecasts. See Hamill et al., 2013, for further details of the forecast system: Hamill, Thomas M., Gary T. Bates, Jeffrey S. Whitaker, Donald R. Murray, Michael Fiorino, Thomas J. Galarneau, Yuejian Zhu, and William Lapenta. "NOAA's second-generation global medium-range ensemble reforecast dataset." Bulletin of the American Meteorological Society 94, no. 10 (2013): 1553-1565.
Comments
Predictability
a process with "strong deviations" from the long term average is in no way synonymous with more predictability unless the deviations can be predicted. Until we know one way or the other I suggest your "predictability" be replaced be "potential predictability"
Absolutely correct! The path…
Absolutely correct! The path of my morning walk is only predictable to the extent that bears are predictable, which with AI+radar may soon be the case in some places. <a href="https://hakaimagazine.com/news/bear-dar-warns-of-approaching-polar-bear…">Bear-Dar Warns of Approaching Polar Bears</a>
Predictability of the climate is not always easy
Great article, the climate has been changing rapidly and has not been always easy to predict.
Add new comment