Happy Snow New Year from NCEI!
It might seem strange to be talking about Northern Hemisphere Snow cover during the heat of summer, but July 1st was “Snow New Year”: the end of the 2015-16 meteorological snow year and the start of the 2016-17 “snow year.” As most people do at the start of a new year, we’re reflecting on events from the past year to understand where we have been and where we might be going. In this Beyond the Data blog post, we will dig deeper into the Northern Hemisphere snow cover extent during the 2015-16 snow season and explore change in snow cover over time.
History of snow mapping
To understand Northern Hemisphere snow cover extent, it helps to examine its history. Thanks to the hard work of scientists at NOAA, NASA, and the Rutgers Global Snow Lab, we have weekly and monthly snow cover extent data back to November 1966, when satellite records began. Back then, using satellites for weather science was a new endeavor, and at the time we did not have the computer power to process large amounts of data. Instead we had to rely on humans: a meteorologist would manually examine photographs of satellite imagery to determine on a weekly basis what locations had snow on the ground and what locations did not.
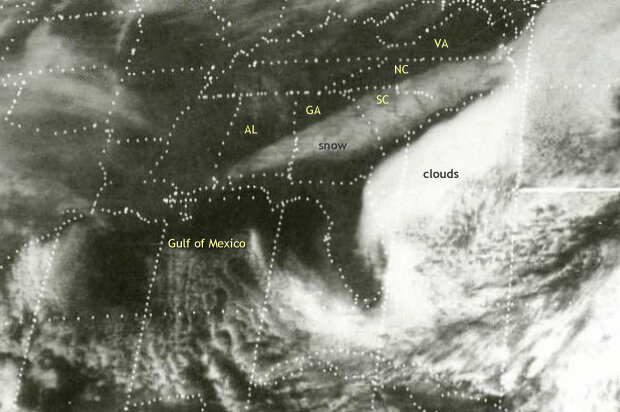
Early snow cover mapping depended on people to interpret paper printouts of satellite images such as this one from February 11, 1973. Today, computers analyze digital images and identify snow-covered areas using rules developed by scientists. This image is one frame of an animated gif of a major snowstorm in the U.S. Southeast created by the Wilmington, NC, NWS office, based on scanned hardcopies provided by The Schwerdtfeger Library at The Space Science and Engineering Center (SSEC).
More recently we have been able to rely on improved satellite observations and increased computer processing power to produce the weekly and monthly snow cover extent maps and data. Scientists have done a great deal of work to make sure that the data through the entire record back to 1966 are processed in a consistent way so we can accurately compare today’s snow cover extents to those in 1966.
The typical snow season
As you’d expect, Northern Hemisphere snow cover extent typically reaches an annual minimum during late summer and the highest extent in midwinter. One of the reasons the snow season starts on July 1st is that it nearly coincides with the annual minimum in snow cover in the Northern Hemisphere, and allows us to capture annual snowfall without having to split the winter season.
August has the lowest average monthly snow cover extent at about 1.1 million square miles, or about twice the size of Alaska, with most of the snow cover observed across the high latitudes of the Arctic and in the highest elevations further to the south. Snow cover extent typically reaches its largest extent in mid-winter, with the January average snow cover extent about 18.1 million square miles, covering 31 percent of Earth’s land surface.
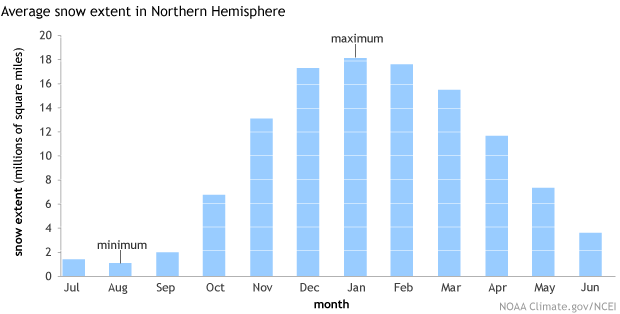
The annual snow cycle in the Northern Hemisphere, based on Rutgers Snow Lab data provided by Jake Crouch, NCEI. Graph by NOAA Climate.gov.
2015-16 snow season recap
The 2015-16 snow season started out with below-average snow cover during July and August 2015, mostly due to below-average snow cover during the preceding winter and spring. When a winter and spring have below-average snow cover, that pattern usually persists into the summer months because new snow only falls at the highest elevations and in the far northern Arctic region.
| Month | Snow cover extent (million square miles) | Difference from average (million square miles) | Rank out of 50 years of data | Trend per decade |
| July 2015 | 0.97 | -0.45 | 5th smallest | -21.3% |
| Aug 2015 | 0.99 | -0.09 | 14th smallest | -11.4% |
| Sept 2015 | 2.27 | +0.25 | 14th largest | +0.8% |
| Oct 2015 | 8.26 | +1.49 | 7th largest | +1.3% |
| Nov 2015 | 13.99 | +0.88 | 7th largest | +0.9% |
| Dec 2015 | 16.79 | -0.50 | 19th smallest | +0.9% |
| Jan 2016 | 18.84 | +0.74 | 9th largest | +0.3% |
| Feb 2016 | 16.80 | -0.80 | 3rd smallest | -0.2% |
| Mar 2016 | 14.35 | -1.14 | 2nd smallest | -1.2% |
| Apr 2016 | 10.78 | -0.89 | 1st smallest | -1.7% |
| May 2016 | 6.31 | -1.03 | 4th smallest | -4.6% |
| Jun 2016 | 2.15 | -1.48 | 3rd smallest | -13.7 |
Moving into autumn, early-season snow storms across the higher latitudes of Alaska and Siberia during September followed by storms across the mid-latitudes of Canada, the United States, China, and Russia in October and November boosted autumn snow cover extents to above-average territory. By late autumn, above-average snow cover was observed across most of North America, Europe, and Asia.
December 2015 was an exceptionally warm month across most land areas of the Northern Hemisphere, particularly eastern North America, eastern Europe and much of Russia. This warmth contributed to a drop in snow cover extent for the month, but an active winter storm pattern across Europe and North America in January 2016 caused monthly snow cover to rebound to above average. In late January, a massive Nor’easter slammed the East Coast of the United States dropping more than 10 inches of snow from North Carolina to Massachusetts.
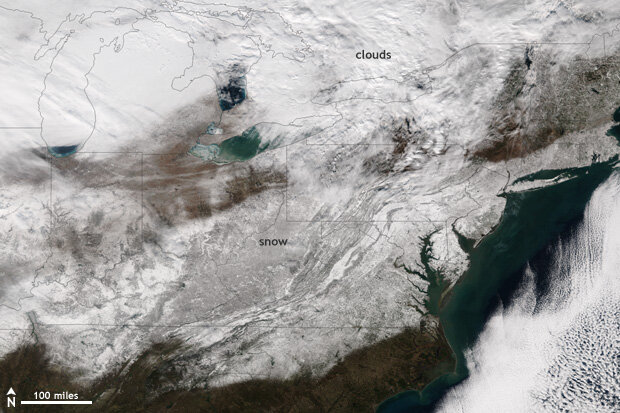
A major snow storm left a trail of white across the Ohio Valley and Mid-Atlantic states in January 2016. NASA/NOAA Suomi-NPP satellite image from NOAA Environmental Visualization Lab.
During February, the snow machine was nearly shut off for large parts of North America, Europe, and western Asia causing snow cover extents to drop off dramatically. That pattern persisted through the spring and into the early summer with each month from March to June 2016 having one of the five smallest snow cover extents across the Northern Hemisphere. The April snow cover extent was record small.
It’s interesting to note that every month during the 2015-16 snow season was record warm for the globe and at least 2nd warmest for the Northern Hemisphere. This shows that despite a warming planet and relatively warm months during the 2015-16 snow season, the cold months of the year can still support relatively large snow cover extents, for now. The meteorological conditions that can cause cold air outbreaks, with Arctic air surging southward, still happen in a warming world. So for now, certain locations can still have above-average snow seasons, even as an overall warming trend continues.
Change over time: Losses outweigh gains
The largest changes in snow cover—big declines—are occurring during the warmer months of the year and during the transition seasons. There has been a slight upward (more snow cover) trend in hemisphere-wide snow cover during the winter months, but that doesn’t mean all places have seen an increase in snow cover during the winter months. To get a get a better of idea of how winter snow cover is changing versus summer snow cover we can compare snow conditions in January to those in June.
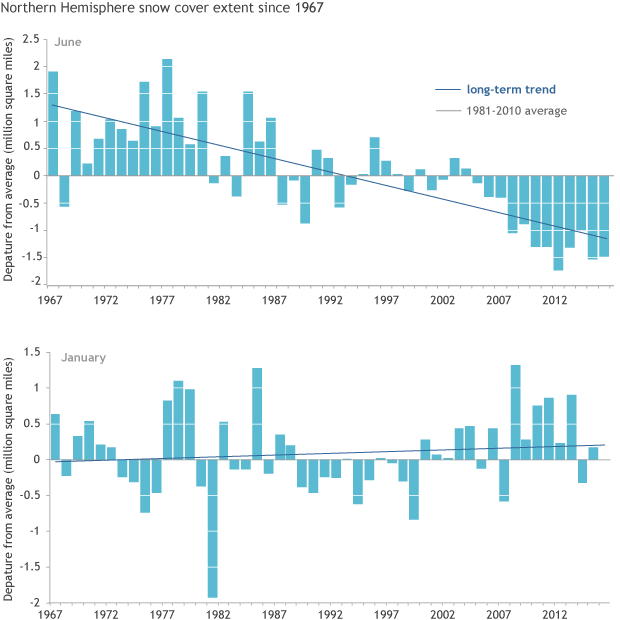
Trends in Northern Hemisphere snow cover from 1967-2016, based on Rutgers snow lab data provided by Jake Crouch, NCEI. Graph by NOAA Climate.gov.
Across the entire Northern Hemisphere, average January snow cover extent is increasing at a rate of 0.3 percent (or about 58,000 square miles) per decade, which in statistical terms is not significant. When it comes to the number of days with snow on the ground, there has been a decrease across parts of the central United States, northern Europe, western Asia, and the Himalayas. But the number of snow covered days has increased in western North America, southern Europe, and central and eastern Asia.
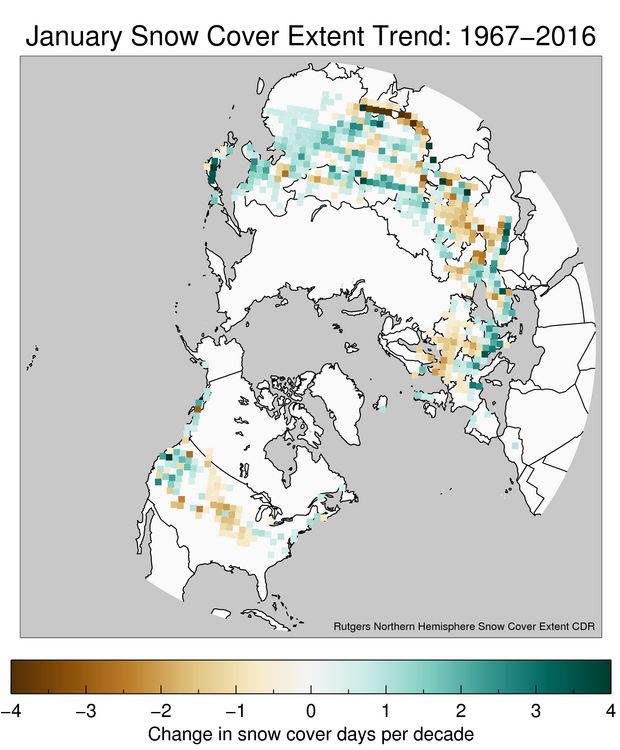
Map of Northern Hemisphere showing where the number of snow covered days in January has increased of decreased since 1967. Map by Jake Crouch, based on Rutgers Snow Lab data.
Generally these changes in snow cover are happening along the periphery of areas where we typically observe snow on the ground in January. We haven’t observed much change in snow cover at the higher latitudes during January, so we focus on where the changes are occurring further to the south, along the edge of the typical snow covered areas.
For June, the Northern Hemisphere snow cover extent is decreasing at a rate of 13.5 percent (about 490,000 square miles) per decade. July is losing snow cover at an even faster rate: 21.3 percent (301,000 square miles) per decade, the highest decline rate among all months.
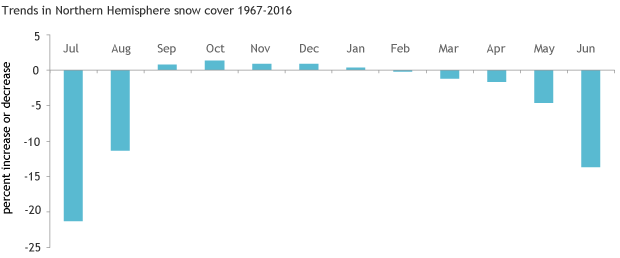
Long-term changes in Northern Hemisphere snow cover by month. NOAA Climate.gov graph, based on Rutgers Snow Lab data provided by Jake Crouch, NCEI.
For most locations that typically have snow on the ground during June, the number of days with snow on the ground is also decreasing rapidly, particularly across the high elevations of western North America, Siberia, and the Himalayas. The dropping snow cover during June represents an earlier melting of snow which has many implications for pests, wildfires, and water resource management.
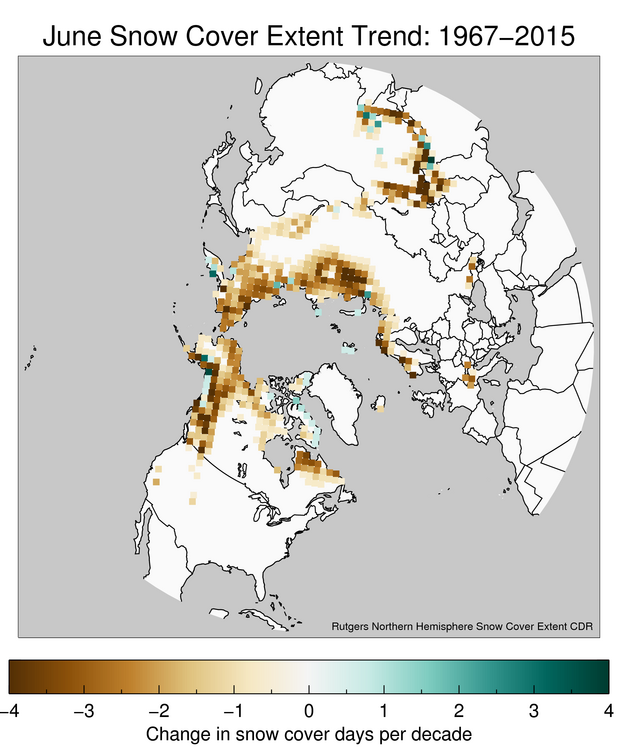
Map of Northern Hemisphere showing where the number of snow-covered days in June has increased (green) or decreased (brown) since 1967. Map by Jake Crouch, based on Rutgers Snow Lab data.
Wrap-up
Our climate is changing, and it is important to monitor factors other than just temperature when we consider how climate change will impact both human and ecological systems. As the world warms and we lose snowpack earlier and earlier in the western United States, the amount of cold water present for fisheries and the amount of water available for residents in places like San Francisco at the end of their dry season could have far-reaching impacts. The climate and all of the parts of the Earth system that are sensitive to changes in the climate can be complicated, but change in snow cover is a relatively simple indicator we can track. Fortunately, we have over 50 years of snow cover data that give us a detailed picture of how it is changing.
The 2015-16 snow season mirrored the general changes that we have seen in Northern Hemisphere snow cover over the past 50 years. There was an above-average snow cover during most of the cold season, but it was followed by a rapid decrease in snow cover during the transition seasons and during the warmest parts of the year. This past snow year and the longer-term trends in snow cover highlight that, even though we live in a warming world, the coldest parts of the year in the Northern Hemisphere can still support relatively large snow cover extents, at least for now.