195506,-0.112888
195509,-1.814083
195512,-8.006949
195603,-2.414768
195606,-4.435912
195609,-2.657124
195612,-0.925602
195703,-4.126613
195706,-5.581200
195709,-3.828830
195712,-4.916474
195803,-0.855497
195806,-1.357916
195809,-0.407367
195812,-3.510767
195903,-4.332010
195906,-0.125907
195909,-2.352136
195912,-1.947549
196003,-2.228227
196006,-1.150040
196009,-0.156131
196012,-2.233870
196103,-2.596117
196106,-2.191756
196109,-0.904012
196112,-2.766685
196203,-1.934748
196206,-3.028738
196209,1.394506
196212,-0.732579
196303,-2.489086
196306,-1.974558
196309,-3.880683
196312,-0.741971
196403,-2.540313
196406,-0.999268
196409,-3.550237
196412,-5.396096
196503,-3.407796
196506,-3.651060
196509,-2.260000
196512,-2.920431
196603,-4.449895
196606,-3.879088
196609,-2.689776
196612,-4.756363
196703,-4.570902
196706,-3.258875
196709,-4.820662
196712,-4.795085
196803,-7.422575
196806,-4.560177
196809,-3.969478
196812,-6.957784
196903,-3.020569
196906,-4.898119
196909,-4.474476
196912,-5.531948
197003,-7.441030
197006,-5.943489
197009,-3.995159
197012,-3.814105
197103,-4.959378
197106,-3.910183
197109,-3.727275
197112,-2.472770
197203,-4.091771
197206,-2.546130
197209,-7.319351
197212,-6.997663
197303,-6.992906
197306,-3.276274
197309,-1.011778
197312,-2.796067
197403,-4.533091
197406,-3.247772
197409,-2.193655
197412,-1.125790
197503,-2.142686
197506,-2.137013
197509,-1.747955
197512,-0.178340
197603,-2.743946
197606,-0.842684
197609,-3.662868
197612,-3.163476
197703,0.753658
197706,1.487195
197709,-0.296610
197712,-1.816407
197803,0.659256
197806,0.186941
197809,-1.208870
197812,0.569558
197903,0.244650
197906,-1.640448
197909,-1.909762
197912,-0.532718
198003,1.621559
198006,1.813644
198009,-0.058621
198012,0.985672
198103,0.466168
198106,0.533019
198109,-1.490330
198112,0.979648
198203,-1.497396
198206,-1.675871
198209,-5.024016
198212,-1.026103
198303,-3.626007
198306,2.378227
198309,-6.587368
198312,-3.216753
198403,2.502179
198406,-2.455978
198409,-2.656893
198412,0.773232
198503,1.784006
198506,1.808964
198509,0.248777
198512,-3.403632
198603,-0.832693
198606,1.703140
198609,-1.313320
198612,-3.706717
198703,-0.207786
198706,-1.371921
198709,-2.150277
198712,0.158229
198803,0.584472
198806,0.316734
198809,1.238749
198812,2.213401
198903,1.054477
198906,2.184499
198909,0.722182
198912,-0.347525
199003,1.214320
199006,-1.216034
199009,-1.483189
199012,2.194469
199103,2.197155
199106,3.209013
199109,2.128846
199112,3.047556
199203,0.985267
199206,1.039358
199209,0.746549
199212,-0.484774
199303,1.901373
199306,0.014944
199309,0.072173
199312,0.746779
199403,1.721586
199406,-0.640411
199409,2.212865
199412,2.744318
199503,3.309005
199506,2.082141
199509,0.500147
199512,3.164881
199603,4.492706
199606,7.236955
199609,2.027039
199612,4.419283
199703,4.525184
199706,3.687088
199709,2.090838
199712,2.676821
199803,3.046107
199806,5.323250
199809,3.689378
199812,5.156275
199903,5.388621
199906,5.638433
199909,6.149937
199912,6.595028
200003,4.844887
200006,5.757782
200009,7.145430
200012,4.938114
200103,3.076658
200106,2.730675
200109,3.212160
200112,7.447564
200203,5.505122
200206,7.580072
200209,7.701444
200212,6.368651
200303,8.746294
200306,9.989262
200309,9.416777
200312,11.654590
200403,11.021722
200406,9.882789
200409,9.770217
200412,10.286994
200503,8.052857
200506,8.463406
200509,7.849959
200512,9.281116
200603,10.343987
200606,9.907466
200609,10.797616
200612,10.671572
200703,9.896998
200706,8.811550
200709,9.611940
200712,9.592806
200803,10.786727
200806,10.336976
200809,10.391797
200812,8.693175
200903,10.176744
200906,9.101278
200909,10.603387
200912,10.623396
201003,11.198472
201006,9.614333
201009,9.911397
201012,10.745736
201103,10.729161
201106,10.042295
201109,12.127405
201112,10.578467
201203,11.747399
201206,10.098619
201209,10.641594
201212,11.275383
201303,13.534068
201306,12.048531
201309,11.164961
201312,13.655460
201403,14.243009
201406,13.165339
201409,11.987585
201412,13.646789
201503,15.846370
201506,14.841905
201509,14.641520
201512,15.156898
201603,15.458530
201606,13.076438
201609,13.078745
201612,14.275308
201703,16.024471
201706,16.228298
201709,14.849831
201712,16.408493
201803,17.503874
201806,15.545946
201809,16.040094
201812,17.797443
201903,18.26557
201906,17.515776
201909,17.219067
201912,17.901997
202003,19.231487
202006,17.514084
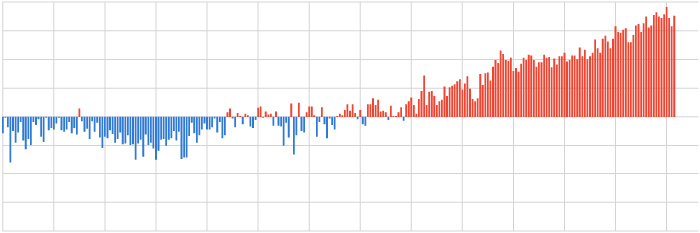
Seasonal heat content in the top half-mile of the ocean compared to the 1955-2006 average. Heat content in the global ocean has been above-average (red bars) since the mid-1990s. Graph by NOAA Climate.gov, based on data from NOAA NCEI.
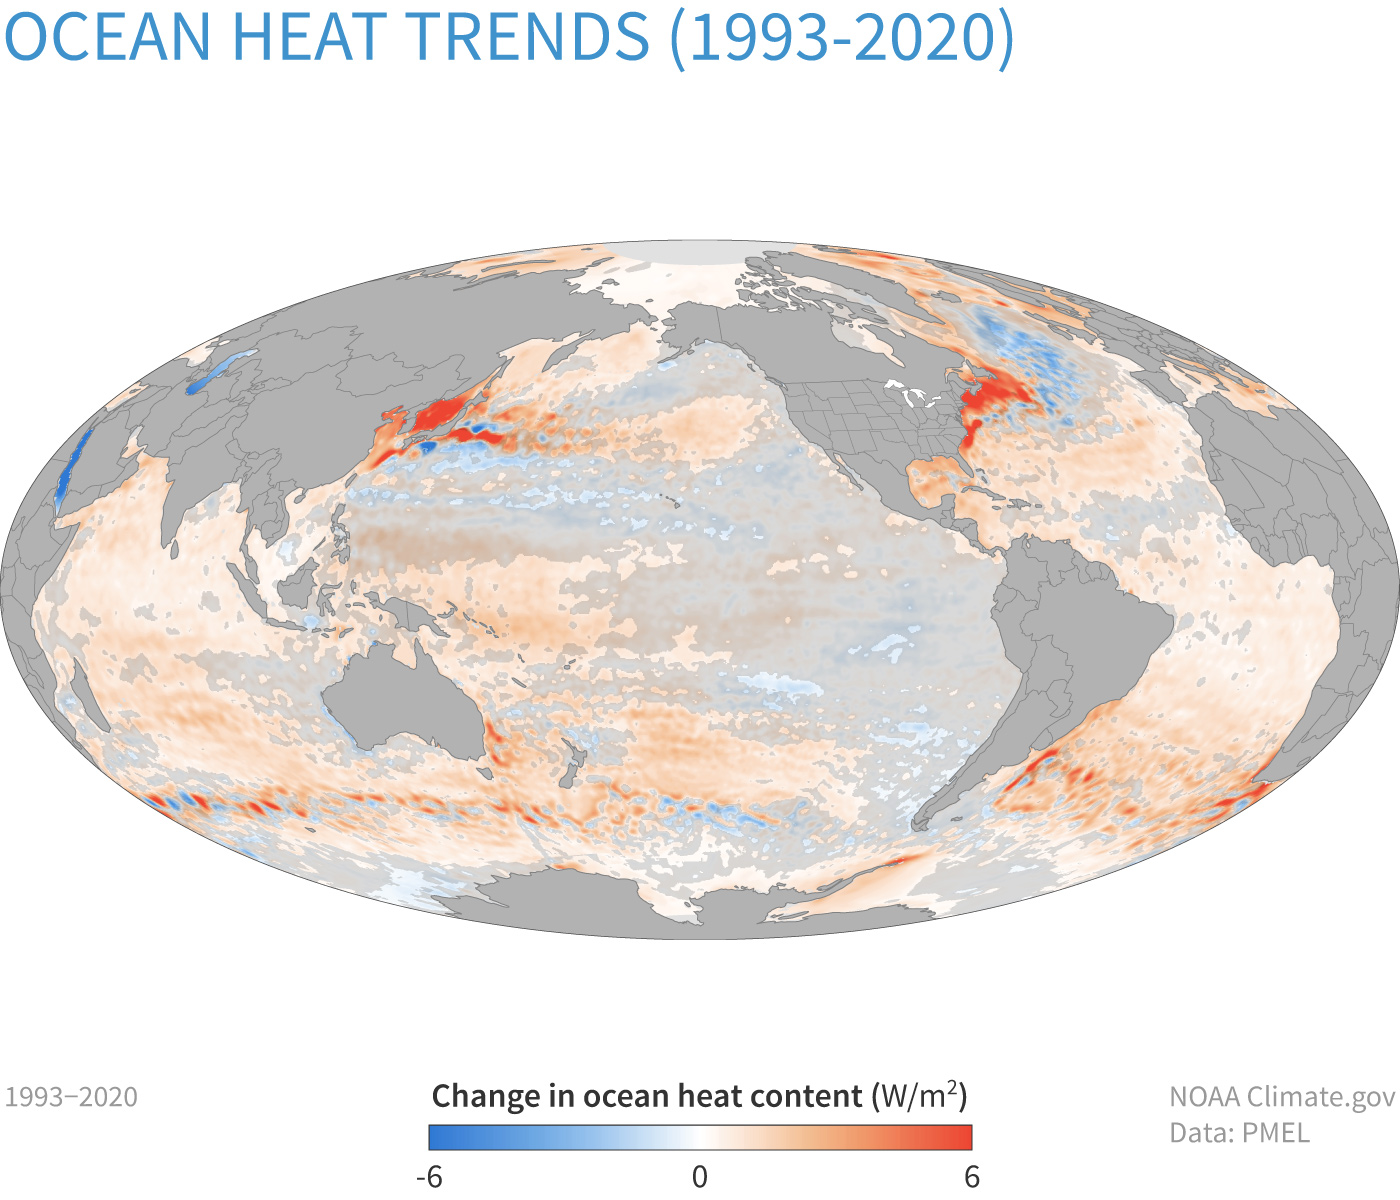
Changes in heat content in the top 2,000 meters (1.2 miles) of the ocean from 1993-2024. More places have gained heat (orange) than lost it (blue). Transparent gray shading means trends are small relative to natural variability. NOAA Climate.gov map, based on data from John Lyman.
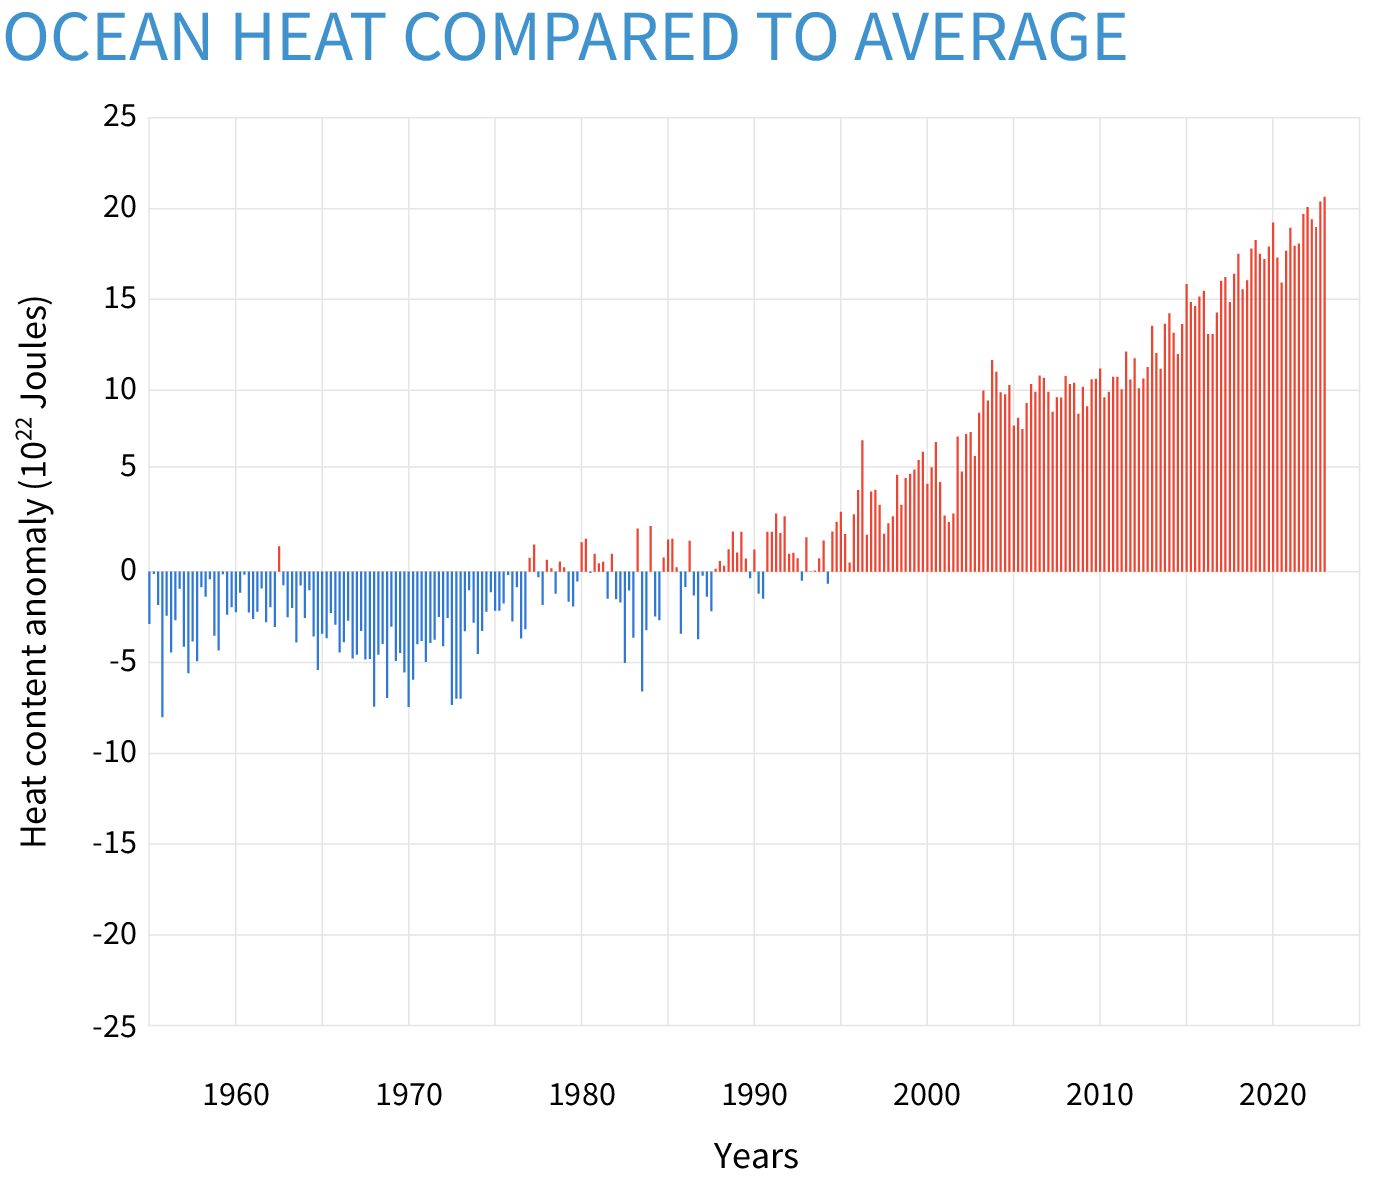
Seasonal (3-month) heat energy in the top half-mile of the ocean compared to the 1955-2006 average. Heat content in the global ocean has been consistently above-average (red bars) since the mid-1990s. More than 90 percent of the excess heat trapped in the Earth system due to human-caused global warming has been absorbed by the oceans. NOAA Climate.gov graph, based on data (0-700m) from the NCEI Ocean Heat Content product collection.
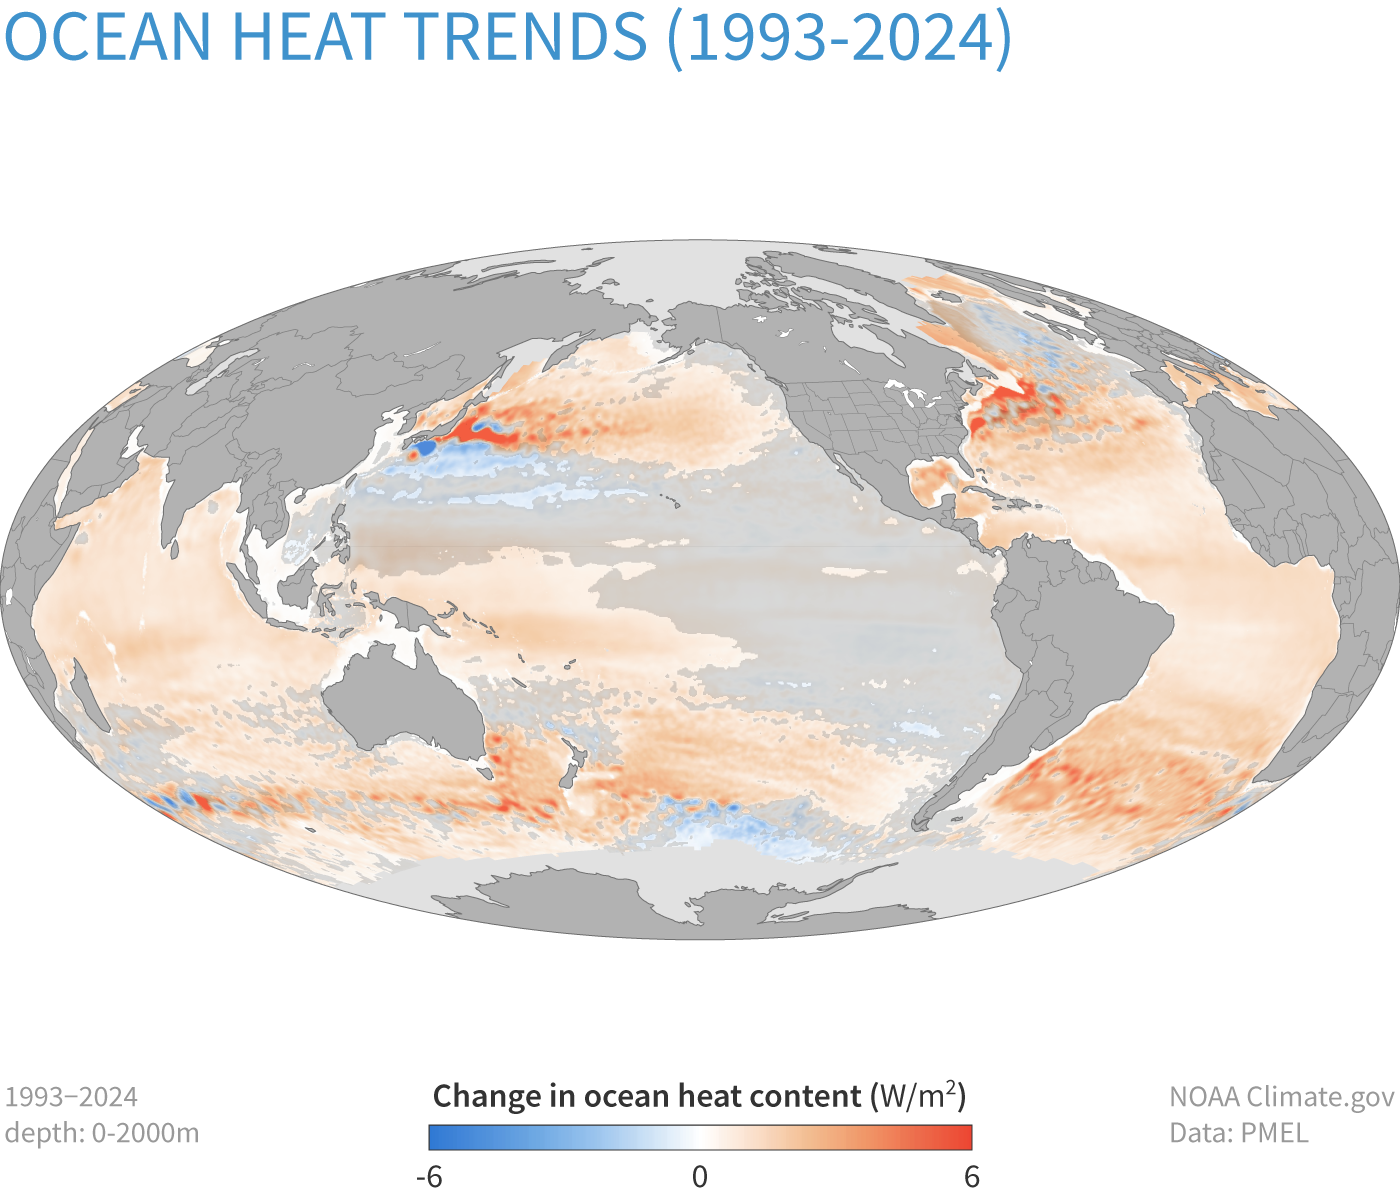
Change in stored heat content in the upper 2,000 meters (1.2 miles) of the ocean from 1993-2024. Darkest orange areas show where heat content increased by 6 or more watts per square meter. Some areas have lost heat (blue), but not enough to offset increases everywhere else. Changes in gray shaded areas were not statistically significant, meaning small relative to the range of natural variability. NOAA Climate.gov image, based on data from John Lyman.