March, March, March
The data are in, and it’s official: March was warm. And parts of the country were dry. And parts were really wet. And you can read all about it in the monthly State of the Climate report.
Let’s go Beyond the Data for March, and hit on a few more complex items embedded within the basic statistics.
Unprecedented widespread warmth
If you were alive during March 2016, and I’m betting you were, you witnessed U.S. history.
One stunning feature from the March 2016 temperature map was just how universally warm the month was. Every one of the 357 climate divisions across the contiguous United States and Alaska ended up - at least - in the “warmer than normal” category. That’s harder than it sounds: it means each of those divisions ended up in the top third of their own histories.
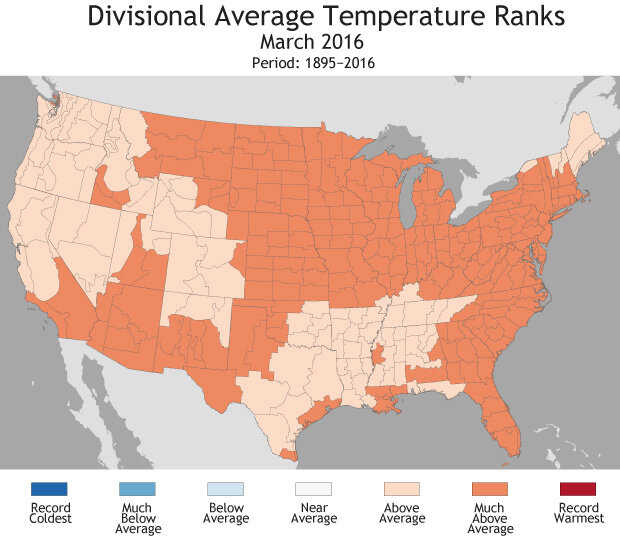
Temperature ranks for March 2016 for the contiguous U.S. Every division made it into at least the "warmer than average" category, which means it was in the upper third of March temperatures in the historical record. NOAA map by NCEI.
I thought that was rare, but didn’t know how rare. So I crunched the numbers back for the more than 1,000 months since the US divisional dataset reached statistical adulthood in 1930: it hadn’t happened before.
At the time they occurred, three months (January 2006, February 1991, and February 1930) had wall-to-wall “top third” outcomes across the CONUS. However, Alaska was on the cold side of history each of these months.
How did March 2016 happen? The nationwide warmth was the result of unusual, and in some cases, record warmth, generally moving west to east across the CONUS. Alaska was just flat out warm, on the heels of a warm, warm winter. In early March, the organizers of the famed Iditarod sled dog race had to alter the race and have snow delivered by rail to Anchorage to get it started.
March rainfall: A regional affair
In contrast to the universal warmth, the precipitation maps show starkly varying regional patterns. The regional patchiness of precipitation was on full display during March. The four corners region was very dry, and in places record dry, while parts of the Mississippi Valley were record wet!
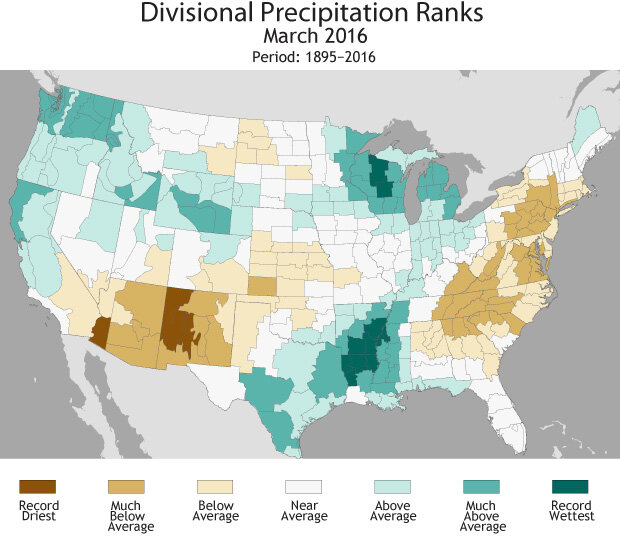
Precipitation ranks for the contiguous U.S. for March 2016. NOAA map by NCEI.
Nowhere was the contrast more evident than neighboring states Texas and New Mexico. The Land of Enchantment had its driest March of the 122 on record, while the Lone Star State had one of its wettest, falling into the “much wetter than normal”, or top ten percent, category.
Incipient drought
Drought is famously a creeping hazard that often arrives unannounced and silently. Monitoring drought takes discipline and a keen eye for some of the telltale signs that tip its arrival. While the nation has understandably been aware of the drought issues that continue to plague the western U.S., the first quarter of the year has not been kind to the Southern Plains and Southwest, either.
We don’t often think of the first quarter of the year to be a critical time for drought in these parts of the world, and to be honest, the heavy-hitting months of spring and early summer are still waiting on deck. But with that said, for a broad swath of the U.S. from Phoenix to St. Louis, it’s been very warm and even drier than usual since the New Year began.
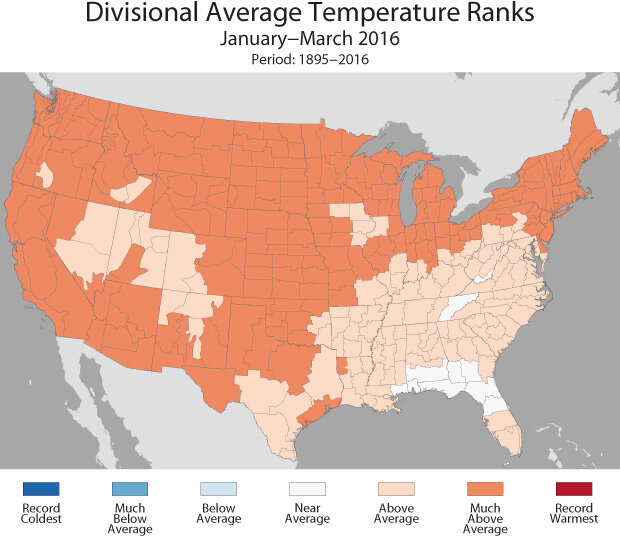
Average temperatures for the contiguous U.S. for January-March 2016. NOAA map by NCEI.
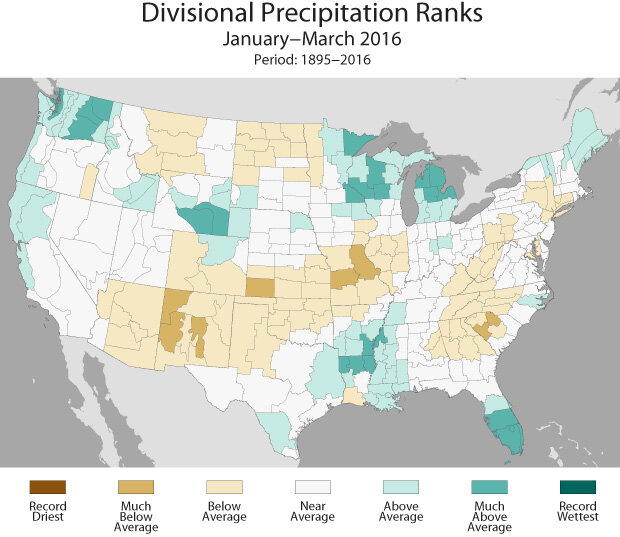
Precipitation ranks in the contiguous U.S. for January-March 2016. NOAA map by NCEI.
In these regions, the warmth of the last few months has felt more like spring than winter, and the combination of this warmth and dryness has pushed the region into developing drought conditions. During a dry spell, all else being equal, a warmer atmosphere exacts a greater toll through “evaporative demand” - think of it as the “tax rate” for drawing moisture out of the ground - than a colder one.
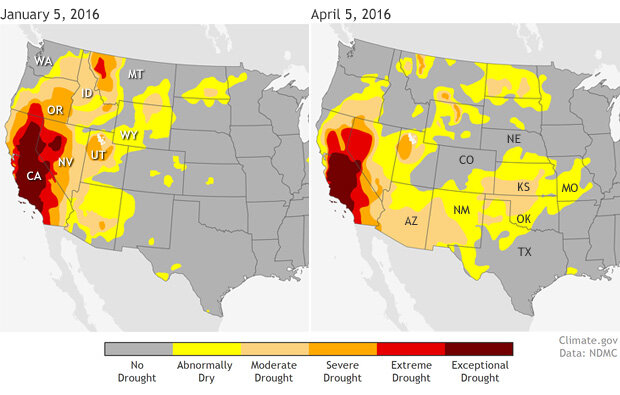
Low precipitation and higher-than-usual temperatures across the Southern Plains allowed drought to rapidly develop in spring 2016. Maps from Data Snapshots, based on data from the U.S. Drought Monitor.
One of the first markers of drought conditions on the prairie is elevated wildfire risk. The folks in Oklahoma and Kansas have seen some pretty epic wildfire conditions in recent weeks. Much of that is driven by the very recent weather, but some of it is related to the drydown since the new year began.
Hopefully, the rest of 2016 won’t play out like 2012, when a brutally warm March east of the Rockies shot the entire plains and Midwest into a drought that was reinforced for many months to catastrophic results.
It’s worth keeping an eye on, and we will: that’s what we do in the Climate Monitoring Branch at NCEI.
Thanks for going Beyond the Data.