Why do ENSO forecasts use probabilities?
Many people are interested in knowing which ENSO category (La Niña, neutral or El Niño) is expected by the climate experts, just as they might want to know the weather forecast for tomorrow. They usually prefer a simple answer—one with little or no uncertainty. Unfortunately, however, weather and climate forecasts are never about certainty: they’re about probability.
Using probabilities allows us to describe the uncertainty in quantitative terms. If there were no uncertainty about what the climate would be like in the future, then one outcome would be given a 100% chance of occurring, while any other outcome(s) would have a 0% chance. While probabilities near 0% and 100% often occur in astronomy and solid state physics problems, they are virtually nonexistent in weather and climate forecasting, due to the fluid and chaotic nature of the ocean and the atmosphere.
Let’s take the example of the bar chart below, showing the latest forecast probabilities for the three ENSO categories for 3-month periods going out to early 2015, issued by CPC/IRI on June 5. How should we interpret this chart?
For each season forecasted, the heights of the three bars indicate the current probabilities for La Niña (blue), ENSO-neutral (gray), and El Niño (red). The sum of the three probabilities for each bar cluster must always add to 100%, because no other outcomes are possible: the sea surface temperature (SST) in the Niño3.4 region has to be either colder than average by a sufficient amount (La Niña), warmer than average by a sufficient amount (El Niño), or near average (neutral). Currently, the official sufficient amount of deviation from average is 0.5˚C.
For all of the seasons being predicted in this particular forecast, El Niño is the most likely category, with the red bars towering over the other bars. During the latter part of 2014 its probability is near or above 80%. This is a fairly confident forecast for El Niño, but it does still leave about a 20% (1 in 5) chance of it not happening.
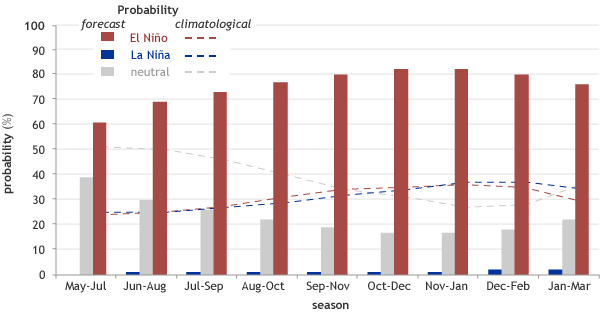
Vertical bar histogram showing probabilities for La Niña, neutral, and El Niño conditions for the remainder of 2014 and into early 2015. Dashed lines show climatological (historical average) probabilities for these same three ENSO conditions. Chart by NOAA Climate.gov, based on data provided by IRI.
So what does historical probability tell us?
An 80% chance is a pretty high probability, which means if the climate were a betting game, we’d be wise to bet on El Niño. But what if the models predicted that the odds of El Niño this winter were 50%? Should we shrug that off?
This is where it helps to have a second kind of information: the climatological probability—the average odds of El Niño, La Niña, and neutral conditions based on how frequently they’ve occurred over a long historical record.
When people envision random chance (“we don't know”), they may think of a two-sided coin flip, with each side having a 50% chance of occurring. However, in the case of ENSO forecasting there are three possible outcomes: El Niño, neutral, and La Niña. Imagine a coin with a very thick edge, so that the chances of getting heads, tails, or having the coin land on its edge are all 33.3%. For any random coin toss—any given season we might consider—intuition might tell us there is a 1 in 3 chance of it being an El Niño season.
While a 1 in 3 chance of El Niño, neutral, or La Niña is a reasonable starting point for a “first guess” as to what we might expect, observations from a recent 30-year period tell a somewhat different story. Those baseline, or climatological probabilities, are shown on the chart as dashed lines.
As you can see in the figure, the climatological probabilities are not flat, horizontal lines at 33.3% all year round. Rather, they vary noticeably by season. Looking at the lines on the figure, we see that during NDJ (November-December-January), the climatological probability for El Niño or La Niña is higher than at any other time of the year, and exceeds 35% for each, leaving less than a 30% likelihood for neutral ENSO. By contrast, during the late spring and summer the reverse is true, as the typical chance of neutral conditions exceeds 50%.
Any bar that is greater than the dashed line of the same color (showing the climatological probability) indicates a heightened chance of that ENSO category occurring relative to the historical average. For example, in the case of the second season being forecast in the figure (JJA), the probability of El Niño is 69% (red bar), but the climatological probability is only 26% (red line), meaning that the chance of it occurring is considerably higher than average—more than double.
The difference between the forecast probability and the climatological probability, called the probability anomaly (69% minus 26%, or 43% in this example), can be important in decision-making, such as in the case when El Niño is associated with drought and/or increased forest fire danger. When a consequence is negative, the probability anomaly may be as important as the actual probability in terms of preparedness for adverse impacts.
Going back to our hypothetical example, if the probability of El Niño this winter were 50% instead of 80%, that would still represent an increase of 24% above the historical average odds. If we were trying to evaluate risk or vulnerability to an EL Niño-related impact, it would help us to consider the odds within the longer-term context.
Why are the odds different in different seasons?
This seasonal difference in the climatolological probabilities of El Niño or La Niña is related to the fact that, during fall, the year-to-year variability of the sea surface temperature (SST) in the Niño3.4 region is usually larger than it is in the spring, so that excursions below -0.5C or above 0.5C are more frequent in fall. This seasonal change in the amount of variability is consistent with the fact that that spring is often the time of year when El Niño or La Niña events are either at their very beginning or have just ended, so the SSTs tend to be closer to their average, while during fall and early winter, ENSO events are in full swing and typically peak.
Although an explanation of why ENSO events follow this seasonal cycle is not fully known and is still being actively researched, facts that are agreed to play a role are, first, that the normal SST in the Niño3.4 region follows a seasonal cycle in which it is warmest during April to June each year, and coldest during November to January.
It is thought that El Niño is encouraged to develop around May because it is usually the basin’s warmest time of year. If other conditions are also met—such as westerly low level wind anomalies that can warm the ocean temperatures above their average, as we observed early this year—the basin is already in a favorable, warm state.
As for why ENSO events tend to dissipate about 9-12 months later, there is a theory called Delayed Oscillator Theory (Suarez and Schopf 1988), in which the low-level westerly wind anomalies trigger two oceanic waves—first, a Kelvin wave that moves to the east and increases the oceanic heat content to the east of the anomalous wind location; and second, a Rossby wave that moves to the west until it hits the Indonesia land mass. The Rossby wave then reflects back toward the east as a “reverse” Kelvin wave, and it acts to cool the subsurface. The cooling subsequently ends the El Niño episode (and sometimes even triggers a La Niña event) about 10 months after it had begun.
The nearly one year time duration of the episode is due to the speeds of the two waves, and the distance between the west and east boundaries of the equatorial Pacific (Indonesia to South America). La Niña is thought to operate approximately symmetrically oppositely to El Niño in these dynamics. It should be noted that the “Delayed Oscillator Theory” is not the only existing hypothesis explaining the typical duration of an ENSO event, but it is one of the most actively researched. More detail about this theory, with illustrative diagrams, is available on a number of links on the Web, such as http://orca.rsmas.miami.edu/~melicie/dmodel1.htm.
References
Suarez, M. J., and P. S. Schopf, 1988: A delayed action oscillator for ENSO. J. Atmos. Sci., 45, 3283-3287.
Comments
ENSO-Pbb
Add new comment