U.S. climate summary for September 2021
With an average temperature of 67.8 degrees Fahrenheit, September was 3.0 degrees warmer than the 20th-century average for the contiguous United States, according to the latest monthly climate update from NOAA’s National Centers for Environmental Information. It was the fifth-warmest September in the 127-year record, bringing the long-term warming trend for September to 1.13 degrees Fahrenheit per century.
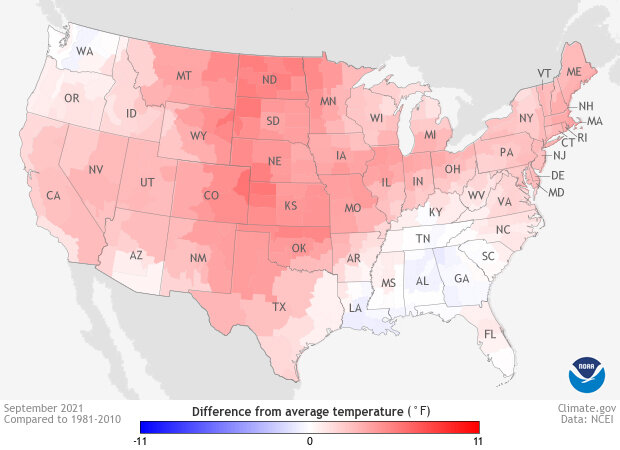
Temperatures across the contiguous United States in September 2021 compared to the 1981-2010 average. NOAA Climate.gov map from Data Snapshots, based on climate division data from the National Centers for Environmental Information.
Compared to August, it was more of the same for much of the Lower 48: warmer than average almost everywhere. The biggest warm anomalies (differences from average) were in the Great Plains from eastern Montana and North Dakota to Oklahoma and the northern Texas panhandle. Only Washington and parts of the Deep South were cooler than average in September.
Meanwhile, the average September precipitation for the contiguous U.S. was 2.33 inches, 0.16 inch below average. That ranked in the middle one-third of the 127-year record, neither especially wet nor especially dry. Regionally, however, there were big extremes of both kinds.
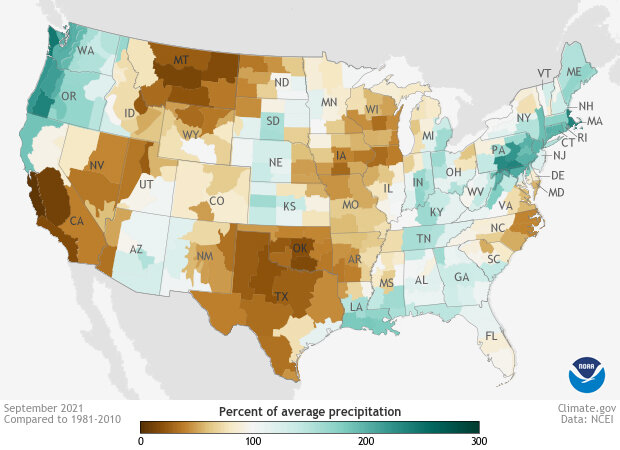
Precipitation across the contiguous United States in September 2021 as a percent of the 1981-2010 normal. NOAA Climate.gov map from Data Snapshots, based on climate division data from NOAA National Centers for Environmental Information.
A series of atmospheric river events boosted precipitation in the Pacific Northwest states of Washington, Oregon, and northern California. On the other side of the country, the remnants of Hurricane Ida contributed to a much wetter than average September in Pennsylvania and parts of surrounding mid-Atlantic states. Major dry anomalies—places where the precipitation was much less than normal—occurred in southern California and Nevada, eastern Montana, and Oklahoma and Texas.
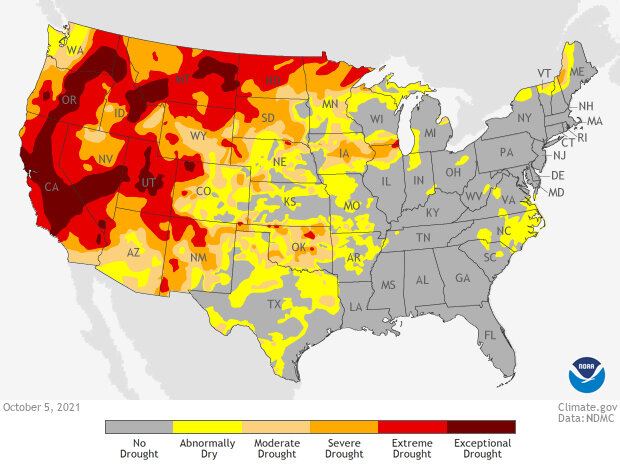
Drought conditions across the contiguous United States as of October 5, 2021. Conditions range from abnormally dry (yellow) to exceptional drought (darkest red). NOAA Climate.gov map from Data Snapshots, based on data from the U.S. Drought Monitor project.
Unfortunately, the September precipitation did little to budge the widespread drought that’s persisted across much of the western half of the contiguous United States for the past year. According to Drought.gov,
Hit-or-miss storms for the Great Plains and Midwest led to some areas seeing precipitation and others nothing, leading to drought improvements right next to degradations. Meanwhile, the West mostly held at status quo, with 52.7% of the western U.S. in Extreme (D3) to Exceptional (D4) Drought. As of October 5, 2021, 39.7% of the U.S. and 47.5% of the lower 48 states are in drought.
- For a deeper look at the U.S. climate conditions for September, visit the National Centers for Environmental Information’s monthly monitoring page.
- Want to know the outlook for October? Read our digest of the latest outlook from the Climate Prediction Center.
- Curious if NOAA is going to declare La Niña this month? Come back to the ENSO Blog on October 14; the forecast comes out the first Thursday of each month.