U.S. Climate Outlook for August 2023
The last month of meteorological summer has arrived, as August brings a close to this three-month season. June and July will be remembered for extreme heat across the southern Plains, particularly across Texas. Elsewhere across the country, June and July were generally quite different with the East and West mainly experiencing below-average temperatures in June and the central part of the nation becoming cooler than average during July.
Will extreme summer heat continue to scorch the southern Plains during August? What is in store for the remainder of the country? Here’s the outlook from NOAA's Climate Prediction Center (CPC).
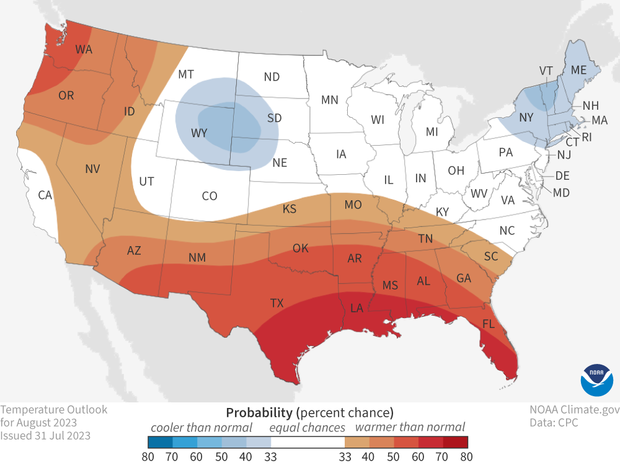
The U.S. temperature outlook for August 2023 (view Alaska), showing places where a much warmer than average August is favored (orange to red) and where a much cooler than average August is favored (light to dark blues). White areas indicate that there are equal chances for a warm, cool, or near-average August. For more details on how to interpret these maps, read our explainer Understanding NOAA's monthly climate outlooks. Map by NOAA Climate.gov, based on data from the Climate Prediction Center.
On July 31, CPC released its updated monthly climate outlooks for temperature, precipitation, and drought across the United States for August 2023. The outlooks favor well above-normal temperatures across the southern and western parts of the country, with odds slightly favoring well below-average temperatures in the western high Plains and in the Northeast. The precipitation outlook favors well above-average precipitation across parts of the central and eastern portions of the country, with well below-average precipitation favored in parts of the Southwest, Southern Plains, and along the Gulf Coast. Interestingly, the precipitation outlook is fairly similar to the outlook for July released on June 30.
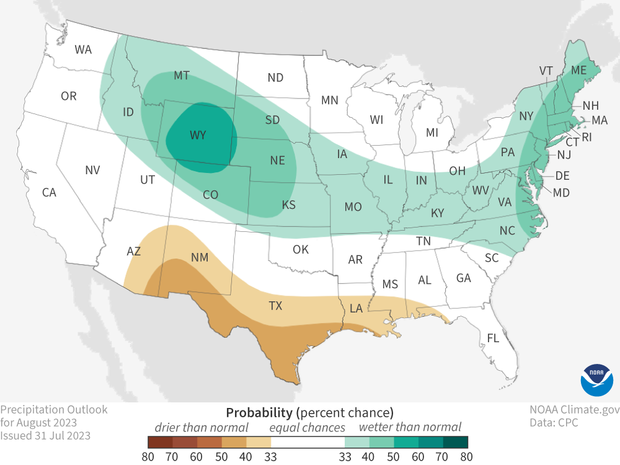
The U.S. precipitation outlook for August 2023 (view Alaska), showing places where a much wetter than average August is favored (greens) and where a much drier than average August is favored (browns). White areas indicate that there are equal chances for a wet, dry, or near-average August. For more details on how to interpret these maps, read our explainer Understanding NOAA's monthly climate outlooks. Map by NOAA Climate.gov, based on data from the Climate Prediction Center.
Below, I’ll discuss these outlooks in more detail as well as some of the factors the CPC used in developing these outlooks. I’ll also discuss the current state of drought and the monthly drought outlook for August. And finally, a reminder about the temperature and precipitation outlooks. The colors on the outlook maps are for the most likely outcome, but other outcomes remain possible, just less likely to occur. More details about interpreting the outlooks can be found here.
The updated outlooks were produced considering the Week 1 forecast from the Weather Prediction Center (WPC), and CPC’s own Week 2 and Week 3-4 outlooks. Other tools that forecasters considered this month were various longer-range forecast models such as the Global Ensemble Forecast System (GEFS), the Climate Forecast System (CFSv2), and products derived from these models. Soil moisture was also a factor, particularly over the southern Plains, where much below-average precipitation has been observed since late May.
Dry soils often contribute to above-normal temperatures during the summer months.
Temperature Outlook
The August temperature outlook favors well above-average temperatures across the southern tier of the country from the Southeast, across the southern and central Plains, into the desert Southwest, and extending through much of the West. The highest probabilities (60-70%) favor a third consecutive month of heat over Texas, as above-average temperatures are favored for much of August. Probabilities for above-normal temperatures are also quite elevated along the Gulf Coast, where sea surface temperatures (SSTs) are well-above normal. Above-normal temperatures are also favored (by 50-60%) in western Washington and Oregon, so these hot summer days are likely to continue across the region this month.
Below-average temperatures are favored only in the northern high Plains and in the Northeast however these odds remain relatively low (below 50%). Temperatures during the first 2 weeks of the month are strongly favored to be below-average in the Plains. In the Northeast more uncertainty exists as the month is likely to begin cooler than average with forecasts for the latter part of the month slightly favoring above-average temperatures.
Precipitation Outlook
Above-average precipitation is favored across the middle of the country from the northern Rockies, northern high Plains, across the Tennessee Valley to the mid-Atlantic and into the Northeast. The odds of wetter-than-normal conditions exceed 50% only over Wyoming, where climatologically heavy amounts of rainfall are forecast during the first week of the month and above-average rainfall is favored during most of the remainder of August. Rainfall is also favored to be above-average in the mid-Atlantic and Northeast, however, odds favoring this remain at less than 50%.
Drier-than-average conditions are favored from the Southwest to the Gulf Coast during August. A weak start to the Southwest monsoon season is expected to continue, with below-average precipitation favored throughout the entire month. Although not as well indicated in the official CPC outlooks, the monthly dynamical models also favor below-normal monthly precipitation totals across Texas and along the Gulf Coast during August.
Drought Monitor
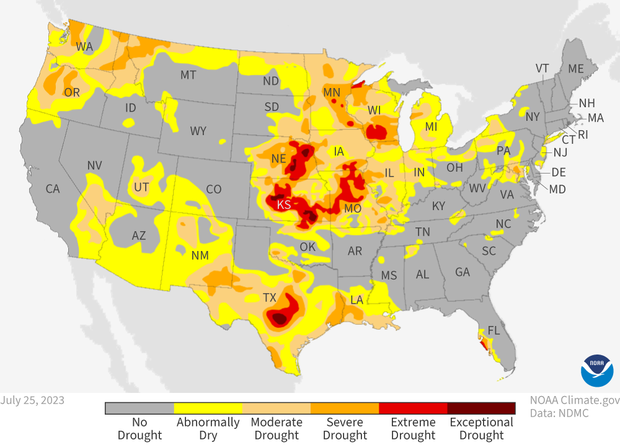
Drought conditions across the contiguous United States as of July 25, 2023. Extreme (red) and exceptional (dark red) drought was confined to the heart of the Great Plains and parts of Texas. NOAA Climate.gov map, based on data from the U.S. Drought Monitor Project. For more details on drought, visit Drought.gov.
During July, the amount of drought across the United States remained remarkably similar to June, with the percent of the contiguous U.S. in drought remaining at 27%. In addition, the percent of the country in the two most intense categories (D3-D4, representing extreme and exceptional drought) also remained similar to June, at just under 3%.
Regionally however, there were significant changes with drought intensifying in the Southwest, Texas, Louisiana, along the west coast of Florida, and across parts of the northern tier from the western Great Lakes to the Pacific Northwest. In contrast, drought improvement was evident from the central Plains eastward across the Midwest into the Northeast. Categorical drought changes across much of country were mainly between 1-2 classes, although improvement up to 3 classes was noted in south-central Kansas and degradation of up to 3 classes was observed in parts of Texas.
Drought Outlooks
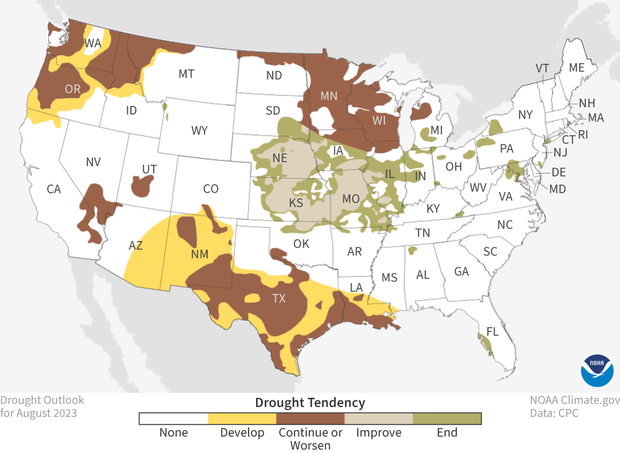
The August 2023 drought outlook for the contiguous United States (view Alaska, Hawaii, and Puerto Rico). Yellow areas are likely to see drought develop. Brown areas are likely to see drought persist. Tan means drought is likely to improve at least 1 category, and green means drought is likely to end. NOAA Climate.gov map, based on data from NOAA Climate Prediction Center.
For August, drought is predicted to improve across large parts of the Central Plains, with some drought removal likely. Meanwhile, complete drought removal is expected across scattered regions of dryness and drought in the mid-Atlantic, the Northeast, and western Florida. In contrast, drought is expected to persist in the Midwest and the Pacific Northwest, potentially expanding beyond its current extent in the Northwest.
Excessive heat and drier-than-normal conditions favor more widespread drought expansion for Texas and Louisiana. With weak monsoon activity and above-average August temperatures favored, drought expansion in the Southwest is likely across eastern Arizona and New Mexico.
To read the entire discussion of the monthly climate outlooks from the Climate Prediction Center, check out their website.