May 2022 U.S. Climate Outlook: Cooler- and wetter-than-normal month favored across the northern tier
Flowers are blooming. Leaves are growing. And my allergies are out of control. It must be spring. So what do those May climate flowers bring? Only one way to find out! Let’s look at the May 2022 climate outlook from NOAA’s Climate Prediction Center.
The last month of meteorological spring is favored to be warmer than average for the southern and eastern United States and cooler than average across the northwestern and northern US. Meanwhile, the month is expected to be wetter than average across the northern tier and Plains, with a tilt towards drier than average across parts of the Southwest.
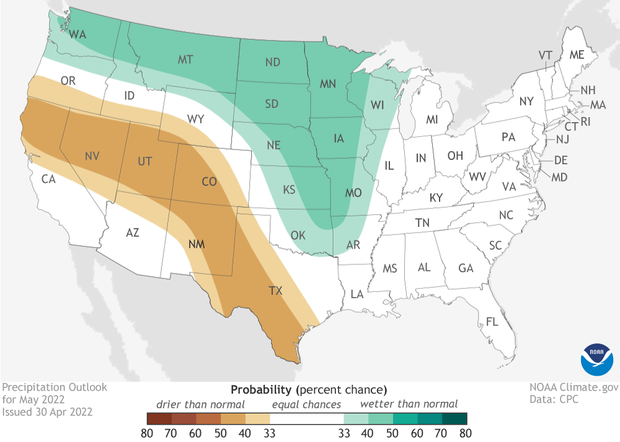
Map of the contiguous United States (view Alaska) showing which of three precipitation outcomes—much wetter than average (green), average, or much drier than average (brown)—are most likely for the month of May 2022. Darker colors mean greater chances, not how far above or below average precipitation is likely to be. White does not mean "average." It means a wet, dry, or near-average April are all equally likely. NOAA Climate.gov image, based on data from the Climate Prediction Center.
A reminder: the climate outlook maps are not a forecast for the absolute temperature or precipitation amounts in May. Instead, they are the probability (percent chance) that monthly average temperature or precipitation will be in the upper, middle, or lower third of the climatological record (1991-2020) for May. We refer to these categories as “well above” and “well below” average. The colors (red or blue for temperatures, brown or teal for precipitation) indicate which outcome is the most likely. Darker colors reflect higher chances of a given outcome, not more extreme conditions. White does not mean average conditions are favored; it means above-, below-, or near-average conditions are equally likely. Head to the end of this post for more on the math behind the outlooks, including how experts calculate the probability of the less likely (but still possible!) outcomes.
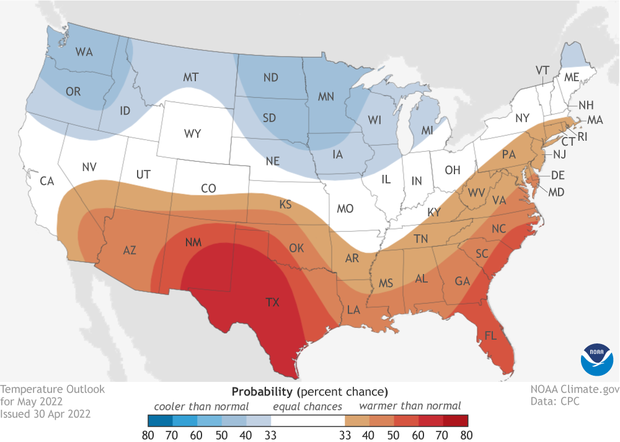
Map of the contiguous United States (view Alaska) showing which of three temperature outcomes—much warmer than average (red), average, or much cooler than average (blue)—are most likely for the month of May 2022. Darker colors mean greater chances, not bigger temperature extremes. White does not mean "average." It means a warm, cool, or near average May are all equally likely. NOAA Climate.gov image, based on Climate Prediction Center data.
Warmth for the southern and eastern U.S., cool across the north
The outlook for May favors a well above average month for the southern tier of the United States along with East Coast outside of New England. The highest likelihood of above-average warmth (60-70%) is across central/western Texas and eastern New Mexico. In contrast, across the northern tier of the United States from the Great Lakes to the West Coast (along with far northern Maine), a cooler-than-average month is favored, albeit only slightly.
This may sound like these forecasts are on repeat but the fact remains, the temperature outlook for May shows the influence of La Niña, which is still ongoing across the Pacific Ocean. This factor combined with what weather and climate models are predicting for the first half of the month played a role in which exact areas of the country are favored for a much warmer or cooler than normal May.
Map of the contiguous United States (view Alaska) showing which of three precipitation outcomes—much wetter than average (green), average, or much drier than average (brown)—are most likely for the month of May 2022. Darker colors mean greater chances, not how far above or below average precipitation is likely to be. White does not mean "average." It means a wet, dry, or near-average April are all equally likely. NOAA Climate.gov image, based on data from the Climate Prediction Center.
Wetness favored across the northwest/north central US and Plains with dryness out West.
The precipitation outlook for May slightly favors (35-50%) a wetter-than-average month for the northern tier from the Pacific Northwest through the Great Lakes and extending south to the central Plains. In contrast, a much drier than average May is slightly favored (35-50%) for parts of the West and Southwest.
Meanwhile, there is equal chance of a(n) above, below, or average month of precipitation for the eastern U.S.
The wet signal for the month is influenced by the current 2-week forecast for a wet second week of May for the northern tier of the U.S., which could tilt the overall monthly precipitation totals to above average, along with a particularly wet forecast for the first couple days of the month across the Plains.
For the eastern United States, weather/climate models and other climate influences are a bit all over the place leading to a high amount of uncertainty, which is the reason for the large area of “equal chances” in the East.
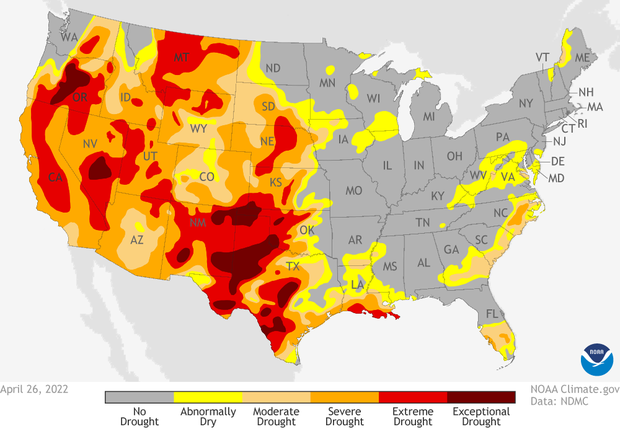
Drought conditions across the contiguous United States as of April 26, 2022. Areas colored dark red indicate the most severe level of drought. Climate.gov map from Data Snapshots, based on data from the U.S. Drought Monitor/Drought.gov.
Western drought continues, but improvement in the Great Plains
As of April 26, 2022, the western drought continues, as 54% of the country remains in drought. Almost 20% of the country is in the two worst categories of drought, extreme and exceptional (D3-4), a 2-3% increase compared to the same time in March. In the West, 91% of the region is in drought, with 37% in D3-4 drought, both increases from late March. Some good news, though. Drought across the Midwest fell from 10% of the region in late March to 1-2% in late April due to spring rains.
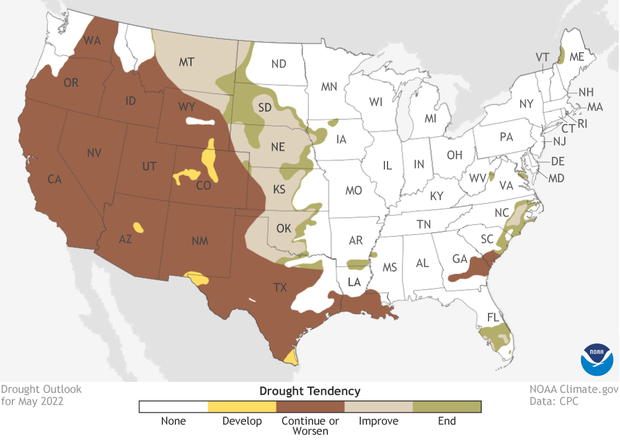
Drought forecast for the Lower 48 U.S. states in May 2022. Brown indicates areas where experts believe drought will persist or worsen. Green areas mean drought is likely to end. Climate.gov map from Data Snapshots, based on data from the Climate Prediction Center.
In some additional good news on the drought outlook front, for May, drought improvement or even removal is on the table across the Great Plains, as a wetter-than-average month is favored. But if you are wondering about the long-lasting drought out West, there is less good news. The drought will continue for another month with only localized areas out West seeing drought development.
To read the entire discussion of the monthly climate outlooks from the Climate Prediction Center, check out their website. And head back to Climate.gov later this month for a United States and global climate recap of April 2022.