International report on 2021 climate: record-high greenhouse gases, ocean heat, and sea level
Greenhouse gas concentrations, global sea levels and ocean heat content reached record highs in 2021, according to the 32nd annual State of the Climate report.
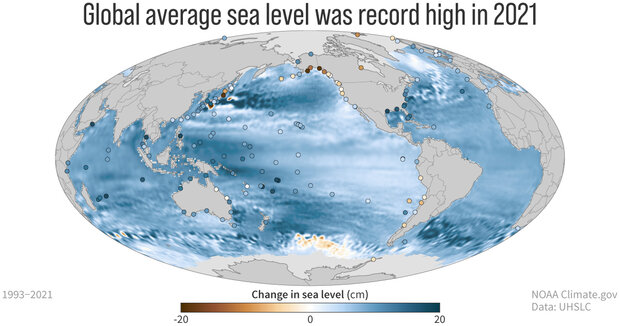
Changes in global sea level (background map) and local sea level (dots) between 1993 and 2021. Global sea level has risen almost everywhere (blue colors). Locally, some coastal areas have seen sea level fall (brown) because the ground there rose faster than global sea level. Most of these areas were buried beneath massive ice sheets during the last ice age, and they are still rebounding from that compression, a process that takes thousands of years. NOAA Climate.gov map, based on data from the University of Hawaii Sea Level Center.
The international annual review of the world’s climate, led by scientists from NOAA’s National Centers for Environmental Information and published by the Bulletin of the American Meteorological Society (AMS), is based on contributions from more than 530 scientists in over 60 countries. It provides the most comprehensive update on Earth’s climate indicators, notable weather events and other data collected by environmental monitoring stations and instruments located on land, water, ice and in space.
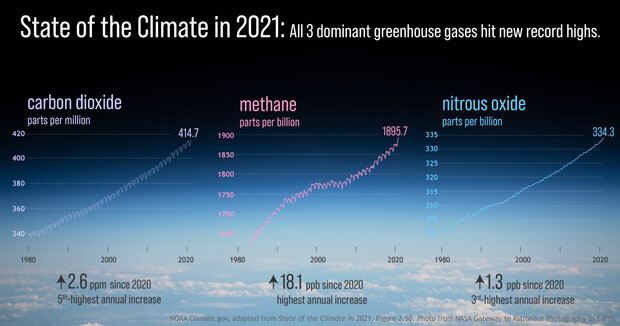
Changes in the amount of greenhouse gases in the air over the span of the modern scientific record: carbon dioxide (left), methane (center), and nitrous oxide (right). All three of these primary greenhouse gases reached new record-high amounts in 2021. The increase in methane was the largest annual increase on record. NOAA Climate.gov image, adapted from Figure 2.50 in State of the Climate in 2021. Background photo from NASA Gateway to Astronaut Photography of Earth.
"The data presented in this report are clear — we continue to see more compelling scientific evidence that climate change has global impacts and shows no sign of slowing,” said NOAA Administrator Rick Spinrad, Ph.D. “With many communities hit with 1,000-year floods, exceptional drought and historic heat this year, it shows that the climate crisis is not a future threat but something we must address today as we work to build a Climate-Ready Nation — and world — that is resilient to climate-driven extremes.”
"The 2021 AMS State of the Climate provides the latest synthesis of scientific understanding of the climate system and the impact people are having on it," said AMS Associate Executive Director Paul Higgins. "If we take it seriously and use it wisely, it can help us thrive on a planet that is increasingly small in comparison to the impact of our activities."
Notable findings from the international report
- Earth’s greenhouse gases were the highest on record. The major atmospheric greenhouse gas concentrations — carbon dioxide, methane and nitrous oxide — each rose once again to new record highs during 2021. The global annual average atmospheric carbon dioxide concentration was 414.7 parts per million (ppm). This was 2.3 ppm greater than 2020 amounts and was the highest measured in the modern observational records as well as the highest in at least the last million years based on paleoclimatic records. The annual average atmospheric methane concentration was also the highest on record, and the annual increase of 18 parts per billion (ppb) was the highest since measurements began. The annual increase in methane has significantly accelerated since 2014. The annual increase of 1.3 ppb for nitrous oxide was the third highest since 2001, contributing to a global annual average atmospheric concentration of 334.3 ppb.
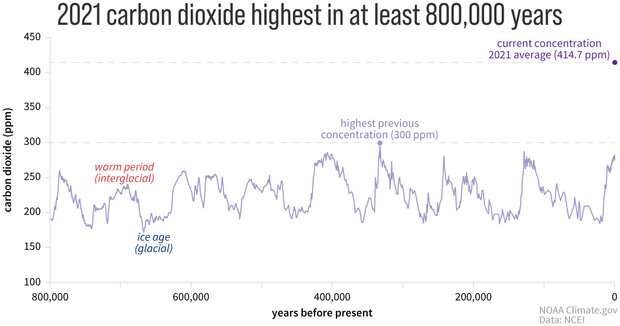
Global atmospheric carbon dioxide (purple line) is higher today than at any point over the past 800,000 years. The highest previous level was 300 parts per million (ppm). The increase since the end of the last ice age has been so fast that on this time scale, it looks practically instantaneous. NOAA Climate.gov image, based on paleoclimate data from Luthi et al., archived at NCEI.
- Earth’s warming trend continued. A range of scientific analyses indicate that annual global surface temperatures were 0.38 - 0.50 degrees F (0.21-0.28 of a degree C) above the 1991 -2020 average. This places 2021 among the six warmest years since records began in the mid to late 1800s. The last seven years (2015–2021) were the seven warmest years on record, and the average global surface temperature has increased at an average rate of 0.14 - 0.16 of a degree F (0.08 - 0.09 of a degree C) per decade since the start of record-keeping and at a rate more than twice as high since 1981 (0.32 - 0.36 of a degree F, or 0.18 - 0.20 of a degree C, per decade since 1981, according to a range of scientific analyses).
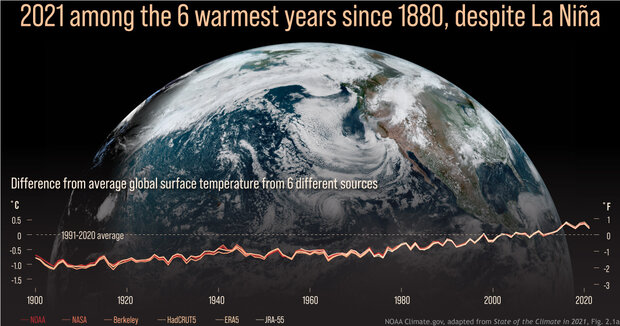
(background) Image of Earth on August 18, 2021, captured by NOAA's GOES-West satellite. (graph) Annual surface temperature from 1880-2021 compared to the 1991-2020 average from 6 different data sources. Global temperature has risen nearly 2 degrees Fahrenheit (1 degree Celsius) since the pre-industrial era. NOAA Climate.gov image, adapted from Figure 2.1a in State of the Climate in 2021. GOES image by NOAA Environmental Visualization Lab.
- Ocean heat and global sea level were the highest on record. The ocean sequesters the vast majority of the excess energy trapped in the Earth's system by greenhouse gases and other factors; estimated at more than 90% over the past half-century. Global ocean heat content, measured from the ocean’s surface to a depth of more than 6,000 feet, continued to increase and reached new record highs in 2021. For the 10th consecutive year, global average sea level rose to a new record high and was about 3.8 inches (97.0 mm) higher than the 1993 average — the year that marks the beginning of the satellite measurement record.
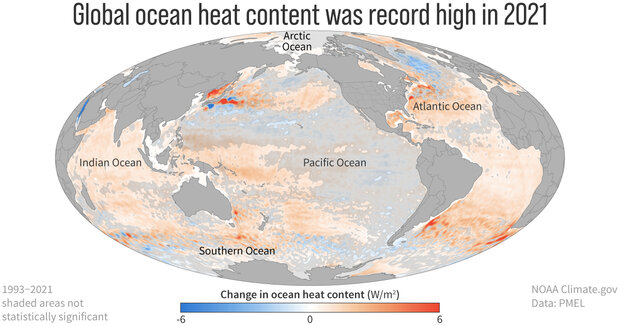
Most of the excess energy being trapped in the Earth system by increasing amounts of greenhouse gases is stored in the ocean. This map shows where the global ocean gained (orange) or lost (blue) energy between 1993 and 2021. Places where the trend is small relative to year-to-year variability (not statistically significant) are shaded with gray. NOAA Climate.gov map, based on data provided by John Lyman.
- La Niña conditions lowered sea surface temperatures. La Niña conditions that began in mid-2020 continued for most of 2021. The annual global sea surface temperature in 2021 was lower than both 2019 and 2020 due in part to La Niña, but was still 0.52 of a degree F (0.29 of a degree C) higher than the 1991–2020 average. Approximately 57% of the ocean surface experienced at least one marine heatwave during 2021.
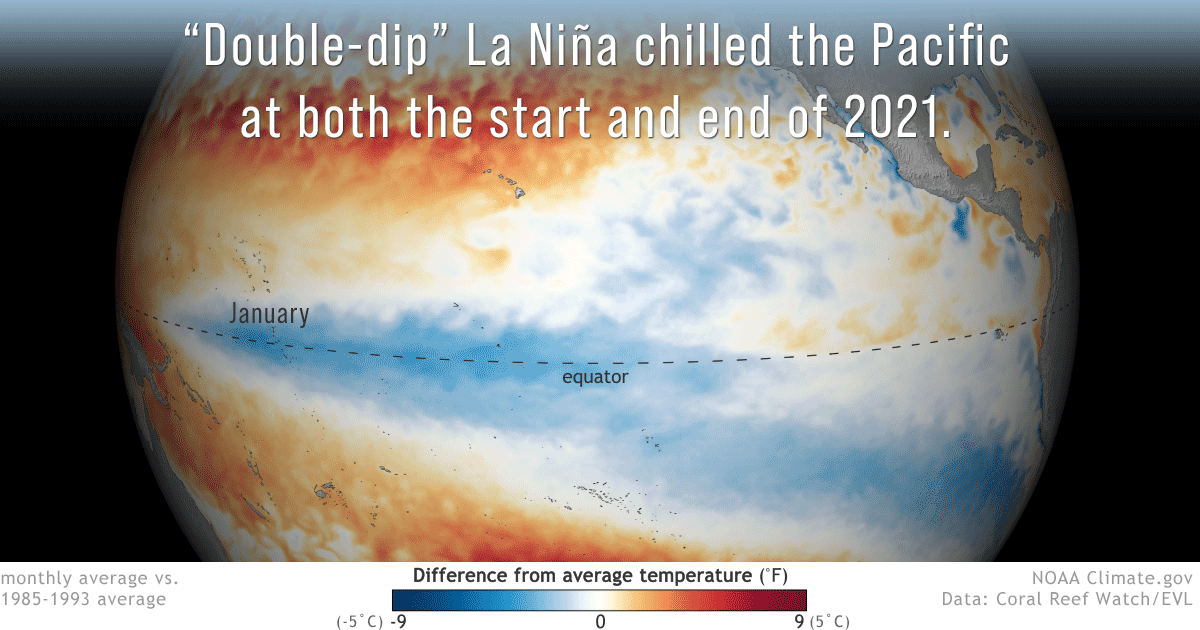
Animation of monthly sea surface temperatures across the Pacific Ocean compared to the 1985-1993 average from January-December 2022. With La Niña—the cool phase of the El Niño-Southern Oscillation climate pattern—in place at the start and end of the year, the Pacific was cooler-than-average (blue) at the equator throughout much of the year. NOAA Climate.gov image, based Coral Reef Watch data. Maps from our Data Snapshots collection.
- Temperatures were mixed in the Southern Hemisphere. La Niña contributed to the warmest year on record for New Zealand, but also to the coolest year since 2012 for Australia. On Antarctica, cold air within a strong, stable polar vortex contributed to the coldest winter (from April through September) on record at the South Pole. On the Antarctic Peninsula, the only part of the continent which reaches beyond the Antarctic Circle, two stations received persistent warm northerly winds; one station tied its highest annual temperature on record while the other experienced its second highest recorded temperature.
- The Arctic was cooler overall, but some records were set. The Arctic had its coolest year since 2013, but 2021 was still the 13th warmest year in the 122 year record. Extreme heat events occurred during the summer. During a massive heat wave in western North America, a temperature of 103.8 degrees F (39.9 degrees C) was recorded on June 30 at Fort Smith, Northwest Territories, Canada; this was the highest temperature ever recorded above 60 degrees North latitude. A widespread melting event on the Greenland Ice Sheet on August 14, 2021—the latest in the season on record—coincided with the first observed rainfall in the 33 year record at the Summit Station, which sits at more than 10,500 feet (3,200 meters) above sea level. While the Arctic minimum sea ice extent was the 12th smallest extent in the 43 year record, the amount of multiyear ice—ice that survives one or more summer melt seasons—remaining in the Arctic was the second lowest on record. This indicates the Arctic’s sustained transition to a younger, thinner ice cover, which is more likely to experience complete melting in the future.
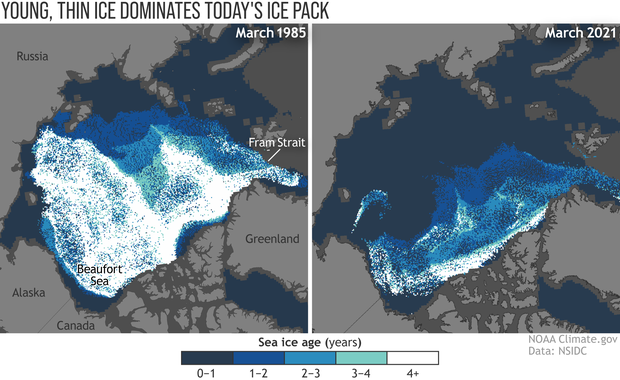
Routine observations of Arctic sea ice thickness only began about a decade ago, experts use the age of the ice pack—which has been observed since the 1980s—as a proxy for ice thickness. In mid-March 1985 (left), the winter maximum ice pack was dominated by ice at least 4 years old (white). In 2021 (right), only a small strip of very old ice remained tucked up against the islands of the Canadian Arctic. More than half of the winter ice pack was less than a year old (dark blue). NOAA Climate.gov image, based on data from the National Snow and Ice Data Center.
- Tropical cyclone activity was well above average. There were 97 named tropical storms during the Northern and Southern Hemisphere storm seasons last year, well above the 1991–2020 average of 87. Seven tropical cyclones reached Category 5 intensity on the Saffir–Simpson Hurricane Wind Scale. The North Atlantic hurricane basin recorded 21 named storms, the third most for the basin, behind the record 30 cyclones in 2020 and 28 in 2005. Category 4 Hurricane Ida was the most impactful storm in the Atlantic. At $75 billion (U.S. dollars) in damage, Ida was the costliest U.S. disaster of 2021 and the fifth most expensive hurricane on record since 1980. Super Typhoon Rai was the third-costliest typhoon in the history of the Philippines causing about $1 billion (U.S. dollars) in damages and more than 400 deaths.
The State of the Climate report is a peer-reviewed series published annually as a special supplement to the Bulletin of the American Meteorological Society. The journal makes the full report openly available online. NCEI’s high-level overview report is also available online.
Media contacts
John Bateman, john.jones-bateman@noaa.gov, (202) 424-0929
Rachel Thomas-Medwid, rthomas@ametsoc.org, (617) 226-3955