Climate Variability: Pacific–North American Pattern
A pattern of air pressure anomalies—departures from the long-term average—at four locations over the Pacific Ocean and North America correlate with regional temperature and precipitation anomalies across North America. This pattern, known as the Pacific-North American teleconnection pattern or PNA, influences regional weather by affecting the strength and location of the East Asian jet stream, and subsequently, the weather it delivers to North America.
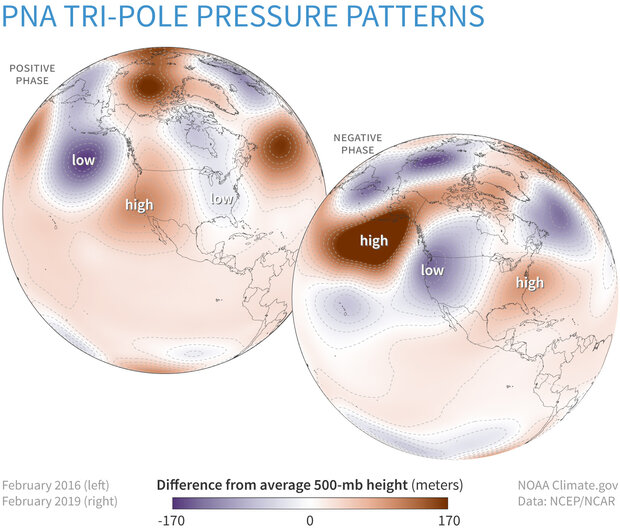
The Pacific-North American atmospheric pattern has two phases. The top map shows pressure patterns in February 2016 compared to the 1981-2020 average (positive phase), and the bottom shows February 2019 (negative phase). The location of highs and lows and the flow of the jet stream around them often produce a sharp warm-cold split in temperatures in the western and eastern halves of the United States. The negative phase is also linked to favorable conditions for tornado outbreaks. NOAA Climate.gov, based on data from the Physical Science Lab.
A pattern of higher-than-average pressure in the vicinity of Hawai'i and over the mountainous region of western North America, and lower-than-average pressure south of Alaska and over the southeastern United States defines the positive phase of PNA. This pressure pattern enhances the strength of the mid-latitude jet stream as it moves over the Pacific Ocean from eastern Asia. This situation increases the likelihood of above-average temperatures over western Canada and the extreme western states of the U.S., and below-average temperatures across south-central and southeastern states. In winter, the positive phase is also associated with below-average precipitation in the Pacific Northwest and across the eastern half of the United States.
The negative phase of the PNA pattern is associated with a weaker jet stream across the central Pacific Ocean, high-pressure "blocking" of atmospheric flow in the high latitudes of the North Pacific, and a split-flow of the jet stream over the central North Pacific. Temperature and precipitation departures from normal during negative PNA phases are generally opposite those of the positive phase.
Although the PNA pattern is an independent mode of climate variability, it is also influenced by the El Niño–Southern Oscillation (ENSO) cycle. The positive phase of the PNA pattern tends to be associated with El Niño conditions, and the negative phase tends to be associated with La Niña conditions.
NOAA's Climate Prediction Center provides direct access to PNA Data from 1950 through the present.