Climate change: spring snow cover in the Northern Hemisphere
Records from the last five decades show that spring snow cover is disappearing earlier in the year than it did in the past. The area of snow-covered ground is declining most rapidly in June, a month when, historically, Siberia, Alaska, and northern Canada remained partially snow covered. Across the Northern Hemisphere, the total area covered by snow during March and April—the end of the snow season for much of the mid-latitudes—has also shrunk over time.

Map of April–June snow cover trends across the Northern Hemisphere from 1972–2024 based on satellite observations of the number of days each location had snow on the ground each year. Places where snow-covered days declined by up to three days per decade are shown in brown; places where snow-covered days increased by up to 3 days per decade are blue-green. (Only places that had snow in at least 25% of the years on record are included in the analysis). Most of the Northern Hemisphere has experienced declines in the number of snow-covered spring days over the past 5 decades. NOAA Climate.gov map, based on data and analysis by Rutgers Snow Lab.
Natural patterns of climate variability such as the El Niño-Southern Oscillation and the Arctic Oscillation can affect the total amount of snow that falls each year. In different phases of these climate patterns, some regions receive abnormally large or small amounts of snow. Despite this yearly variability, the long-term trend in the Northern Hemisphere spring snow cover is negative. Between 1967 and 2022, April snow cover declined by 1.32 percent per decade, May snow cover by 4.1 percent per decade, and June snow cover by 12.95 percent per decade. (Explore trends in monthly snow cover using the Sea Ice and Snow Cover Tool at NOAA National Centers for Environmental Information.)
Looking at just the Arctic, snow cover extent, duration, depth, and water stored by the snowpack are all declining. Overall, snow is declining in both the Eurasian Arctic and the North American Arctic, although just how far below average the snow extent is varies from month to month and region to region as a result of natural variability. For example, according to NOAA's 2021 Arctic Report Card, 2021 spring snow cover extent in the Eurasian Arctic was well below average in May (5th lowest on record) and June (3rd lowest). In the North American side of the Arctic, however, snow deficits were smaller, ranking 14th lowest in May and 16th lowest in June. In fact, spring snow cover in the Arctic is disappearing even faster than summer sea ice.
Measuring snow extent
Beginning in the 1960s, weekly maps of snow extent in the Northern Hemisphere have been made from satellite imagery. Now, satellites provide daily maps of snow cover for both hemispheres. Ground observations, precipitation gauges, and weather stations with pressure-sensitive “pillows” measure the amount of snow on the ground and validate the satellite maps.
Impacts of snow loss
About one-third of Earth’s land surface is covered by snow for some part of the year. The bright white covering affects global conditions by reflecting solar energy away from surfaces that would otherwise absorb it. Therefore, the earlier decrease in snow cover increases the amount of sunlight absorbed by Earth, and in turn, surface temperatures. In step with earlier dates of spring budburst for many plant species, reduced spring snow cover is a sign that winter conditions are lasting for a shorter period while growing seasons are getting longer.
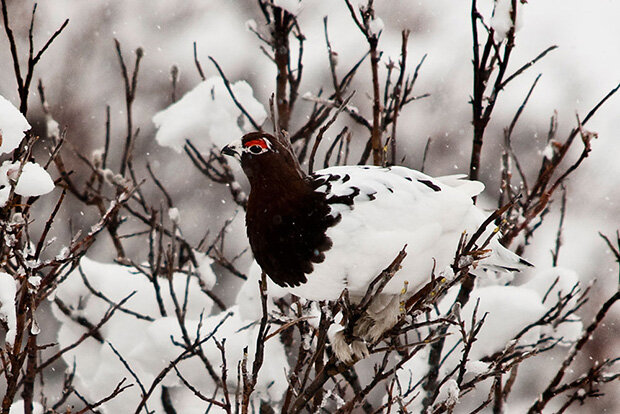
A willow ptarmigan mid-way between its brown summer and all-white winter plumage. In the cold season, these Arctic birds burrow under an insulating layer of snow that piles up in willow thickets. Lack of snow leaves them exposed to the elements and to predators. NPS photo by Tim Rains.
At regional and local scales, water resource managers, flood forecasters, and farmers are intensely interested in knowing how much water is in snow and when it will melt. Locally, snow provides moisture to soil and plants. On a larger scale, runoff from melting snow feeds streams and rivers that supply water for agriculture and cities. Knowing when and how quickly snow will turn to water is essential for forecasting if water from snowmelt will soak into the ground or cause flooding. In managed watersheds, earlier melting of snow can change when and how much water is available for various uses.
References
Mudryk, A. Elias Chereque, R. Brown, C. Derksen, K. Luojus, and B. Decharme. (2021) The Arctic: Terrestrial snow cover [in “State of the Climate in 2021”]. Bull. Amer. Meteor. Soc., 102 (8), S287–S290, https://doi.org/10.1175/BAMS-D-21-0086.1.
Robinson, D.A. (2021). Northern Hemisphere continental snow cover extent [in “State of the Climate in 2020”]. Bull. Amer. Meteor., 102 (8), S46–S47, https://doi.org/10.1175/BAMS-D-21-0098.1
Robinson, D.A. (n.d.). Northern Hemisphere Continental Snow Cover Extent: 2021Update (pdf). Rutgers Snow Lab website.
Rutgers University Global Snow Lab, Data History. Accessed August 29, 2011.
United States Department of Agriculture National Resources Conservation Service, SNOTEL Data Collection Network Fact Sheet. Accessed August 29, 2011.