Climate Change: Incoming Sunlight
The Sun’s energy output changes over multiple time scales. The most regular pattern is an 11-year cycle of high and low activity caused by reversal of the Sun’s magnetic poles. During strong cycles, the Sun’s total brightness at solar maximum is about 0.1 percent higher than it is at solar minimum.
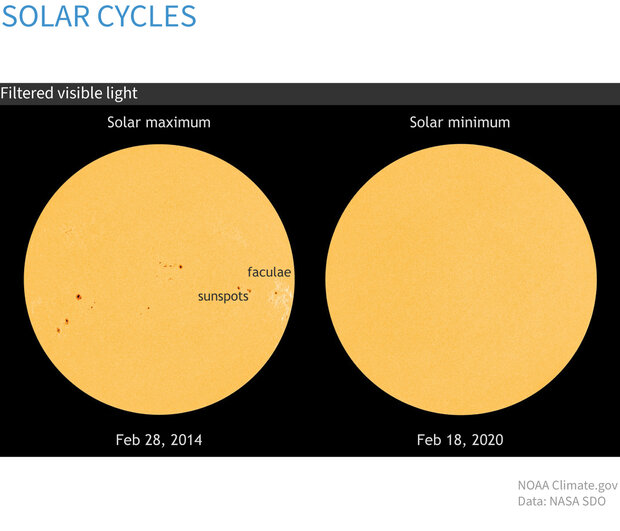
Intensitygrams—images of the Sun in filtered visible light—based on data from NASA's Solar Dynamics Observatory telescope on February 28, 2014, (left), near the maximum of the last solar cycle, and on February 18, 2020 (right), near the solar minimum. Dark patches called sunspots are easier to see than their companion faculae, diffuse bright areas that contribute to making the Sun slightly brighter during solar maximum. Images from NASA SDO.
Averaged over the complete solar cycle, there’s been minimal long-term change in the Sun’s overall brightness since the start of the Industrial Revolution. Records of sunspots show increased solar activity during the first 7 decades of the 20th century, likely tied to the peak of the last 100-year Gleissberg Cycle. Following that peak around 1960, solar activity declined. In fact, activity during the most recent solar cycle is among the lowest in a century. Meanwhile, the rate of global warming has accelerated over the past few decades.
A comprehensive review of published scientific research by the Intergovernmental Panel on Climate Change concluded that, averaged over the solar cycle, the best estimate of the Sun’s brightness change between the pre-industrial period and the present (2019) is 0.06 Watts per square meter. That increase could be responsible for about 0.01 degrees Celsius—around 1 percent—of the warming the planet has experienced over the industrial era (0.95–1.2 degrees Celsius in 2011–2020 versus 1850–1900).

Yearly total solar irradiance (yellow line) and the annual global temperature (red line) from 1850–2024, each compared to the 20th-century average (solid black line) from 1880–2020. Since the middle of the 20th-century, solar activity has declined while global temperature increased rapidly. NOAA Climate.gov image, based on solar data from Coddington et al., 2017, and temperature data from NOAA NCEI.
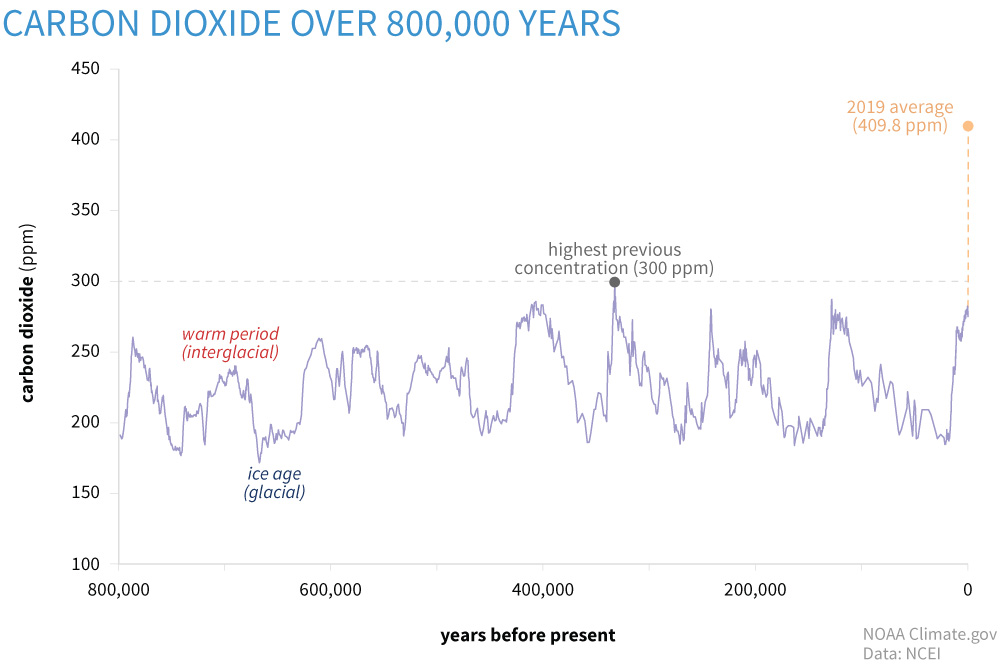
Even if the Sun’s recent quietness—the 11-year cycle minimum in 2011 was the lowest in a century—were to turn into a multi-decade stretch of extremely low activity known as a Grand Solar Minimum, it wouldn’t overpower the amount of global warming projected for the coming century due to increasing greenhouse gas emissions. In fact, as long as atmospheric carbon dioxide remains above 300 parts per million, not even the next ice age, which Milankovitch theory predicts would begin 50,000 years from now, is likely to occur.
The sunspot cycle
The Sun’s brightness changes on multiple time scales, from seconds to centuries to millennia, and these changes can influence climate. The cycle that matters most on human timescales is the 11-year sunspot cycle, which is linked to the reversal of the poles of the Sun’s magnetic fields. The magnetic fields are generated by a dynamo below the Sun’s surface. Astronomers have tracked sunspot cycles since the 1600s by counting sunspots, giant dark splotches that emerge and drift across the surface of the Sun over the span of days or weeks.
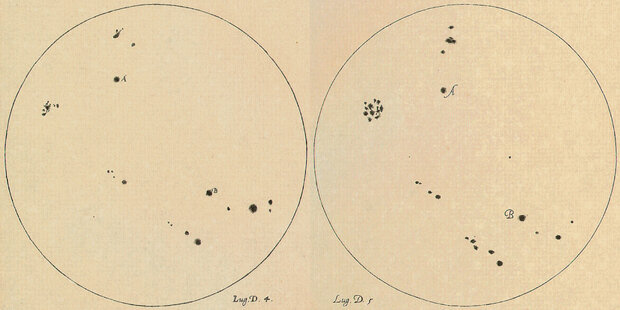
Digital scans of drawings by Galileo, showing sunspots he observed through a telescope on July 4 (left) and 5 (right), 1613. Images courtesy the Galileo Project.
Sunspots are regions on the Sun where the magnetic field is so strong that it blocks convective heat flow to the visible surface. As a result, sunspots are cooler than the surrounding “face” of the Sun. On their own, they make the Sun dimmer by reducing the Sun’s net radiative output. Indeed, some early astronomers and Earth scientists hypothesized that the Sun’s energy output would be lowest when sunspot activity was highest.
But as observing techniques improved, astronomers realized that sunspots were not the only solar feature that altered the Sun’s energy output. Dark spots are usually accompanied by bright magnetic features called faculae. These bright regions are more spread out and have lower contrast than sunspots, which means they are harder to see on the Sun’s visible surface, except when they are near the edges of the solar disk.
As the Sun rotates and sunspots approach the edge of the solar disk, diffuse, bright areas called faculae become visible. Despite dimming caused by sunspots, faculae and other bright features make the Sun a little brighter overall at solar maximum than it is at solar minimum. These images were captured by NASA’s Solar Dynamics Observatory between April 15 and 23, 2014—near the peak of the last solar cycle.
Overlying the visible-light faculae are bright regions called plage that are clearly evident when the Sun is viewed in ultraviolet light. A dense network of dispersed, bright features weaves across most of the Sun’s surface during periods of high activity.
Since the late 1970s, satellites have been documenting the solar cycle directly by measuring the total incoming sunlight received at the top of Earth’s atmosphere and by collecting images of the Sun in a range of wavelengths of light. These observations revealed that as the solar cycle builds, increased brightness from features like faculae and plage exceeds the dimming in sunspots, making the Sun slightly brighter at solar cycle maxima than it is at solar minima.
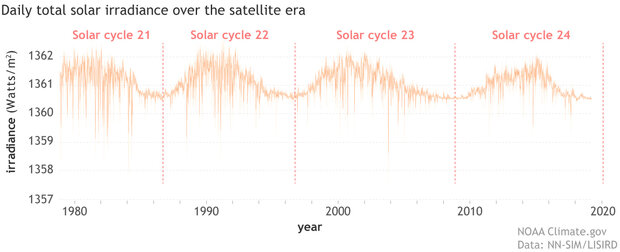
Daily observations of total solar irradiance (orange line) since the start of the satellite era in 1978. Day-to-day, TSI may vary by as much as 0.3 percent, but average differences between maximum and minimum are on the order 0.1 percent, or around 1 Watt per square meter. NOAA Climate.gov image, based on data from LASP Interactive Solar Irradiance Data Center.
Satellite observations through several solar cycles reveal that the difference in total average brightness between solar maxima and minima is very small, on the order of 1 Watt per square meter during strong cycles. On average, the Sun delivers 1,361 Watts of power per square meter at a distance of one astronomical unit. This amount is known as the total solar irradiance. Based on observations and models, experts estimate that the impact of this 11-year variation on global surface temperature is likely around 0.1 degrees Celsius or less.
Long-term changes in solar activity
Scientists today have close to four decades of overlapping measurements of total solar irradiance and sunspots, which allow them to statistically describe how changes in sunspot numbers relate to variations in total solar irradiance. They’ve used that relationship to model the Sun’s brightness back to the start of the sunspot record in the 1600s.
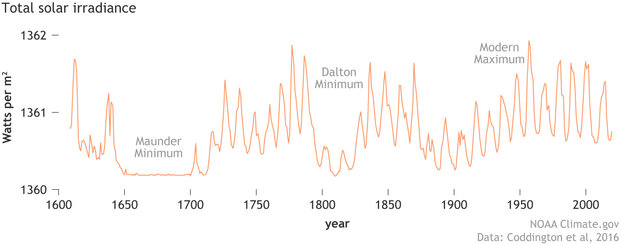
Total solar irradiance estimated from sunspot observations since 1610. NOAA Climate.gov image, based on the NOAA TSI Climate Data Record (Coddington et al., 2016).
These historical reconstructions reveal that some solar cycles are more active than others, and that their timing isn’t completely random. Generally, 2-3 relatively strong cycles will be preceded and followed by 2-3 relatively weak ones. These alternating strong and weak epochs tend to be grouped together over approximately 100-year periods, a pattern known as Gleissberg cycles. Over the span of the historical sunspot record, there have been three ~100-year Gleissberg cycles: 1700-1810, 1810-1910, and 1910-2010.
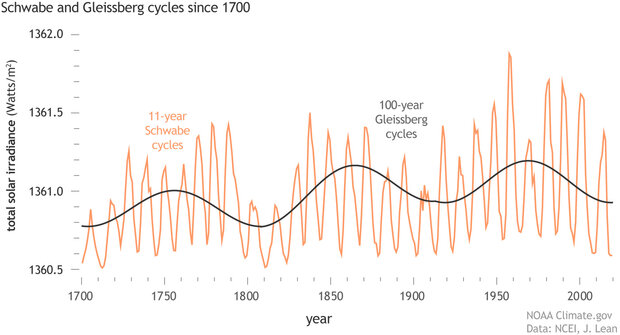
The amplitude of the 11-year solar cycle (formally called the Schwabe cycle, orange) is modulated by the approximately 100-year Gleissberg cycle (charcoal), in which a number of consecutive cycles of high activity are bracketed by consecutive cycles of lower activity. The start of the Industrial Revolution in the mid-1700s coincided with a Gleissberg maximum. The relatively high activity of the mid 20th-century also coincided with a Gleissberg maximum, while the recent decades coincide with a Gleissberg minimum. NOAA Climate.gov image based on data from Wang and Lean, 2021.
In addition, the record shows that there have been periods when sunspots virtually disappear for several decades. (Other features of the 11-year solar cycle continue to occur, however.) These periods are called Grand Solar Minimums. For example, between 1645-1715, the Sun went through a 70-year quiet period known as the Maunder Minimum. Sunspots disappeared almost completely, and the solar wind was maybe half of its modern velocity. The Maunder Minimum partially overlapped a centuries-long cold spell called the Little Ice Age, which was strongest in the Northern Hemisphere between 1450-1850.
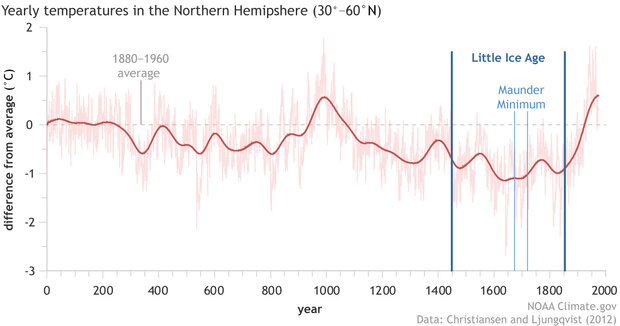
A 2000-year temperature history of the Northern Hemisphere outside the tropics shows a warm period that peaked around 1,000 A.D. followed by a multi-century period of cooling: the Little Ice Age. The coldest part of the Little Ice Age overlapped the very low solar activity of the Maunder Minimum, but the cold spell began well before. NOAA Climate.gov graph, based on data from Christiansen and Ljungqvist, 2012.
In contrast, the Sun was unusually active in the twentieth century, a period which solar experts call the Modern Maximum. Starting near the turn of the twentieth century, each solar cycle was increasingly active. This build up was tied to the last Gleissberg Cycle, which peaked during solar cycle 19 in 1957. Solar activity then declined in the second half of the 20th-century. The stretch of high activity drew to a definite close in the first decade of the twenty-first century with solar cycle 23, which had an unusually long and low minimum. Solar cycle 24 went on to have one of the lowest maximums of the last 70 years, and solar cycle 25 is expected to be comparable. Meanwhile, Earth's surface temperatures continued to rise rapidly.
Taken together, the increasing solar activity of the first half of the 20th century and the decreasing activity since then have largely canceled each other out in terms of their influence on global temperature. In the Sixth Assessment Report from the Intergovernmental Panel on Climate Change, experts concluded that the best estimate for the influence of the Sun on climate between the pre-industrial (1850-1900) and the present (2010-2019) was that it added 0.01 Watts per square meter to the global energy imbalance causing global warming. Such a small energy imbalance (scientists call it a radiative forcing) is likely to be responsible for no more than 0.01 degrees Celsius of warming over that period. That’s 100 times smaller than the overall warming that’s occurred on Earth over the industrial period, which the IPCC estimates as 0.95–1.2 degrees Celsius in 2011–2020 versus 1850–1900.
Future warming vs. a grand solar minimum
The modern sunspot record tells us about solar activity over the past four centuries. Indirect evidence for solar activity deeper in the past comes from the presence of cosmogenic isotopes—radioactive atoms that are generated when common isotopes of an element are struck by galactic cosmic rays.
Our solar system is constantly bombarded with galactic cosmic rays, but the Sun’s magnetic field shields us from most of them. When the Sun’s magnetic field is strong, at solar maximum, fewer cosmic rays reach the atmosphere, creating very few cosmogenic isotopes. At solar minimum, when the Sun’s magnetic field is weaker, slightly more cosmic rays reach Earth’s atmosphere, generating more cosmogenic isotopes. The two most common cosmogenic isotopes are carbon-14, which can be found in tree rings, and beryllium-10, which is found in ice cores. Using fluctuations in cosmogenic isotopes, experts have reconstructed solar activity back thousands of years.
A reconstruction of total solar irradiance over the past 9,400 years based on a combination of carbon-14 isotopes in tree rings and beryllium-10 in ice cores. The record indicates there have been at least 25 Grand Solar Minimums in the Holocene. NOAA Climate.gov image, based on data from Steinhilber et al., 2012.
These paleoclimate reconstructions reveal that the Sun has produced at least 25 grand minimums in the past 9,000 years. Some are short—just two or three decades—and others, like the Maunder Minimum, are five or more decades. They occur every 200 years or so, a period known as the de Vries cycle. Many of them were preceded by a solar cycle with an unusually long and low solar minimum, similar to the minimum of 2008. Naturally, climate experts began to wonder: if the Sun were on the verge of a new grand minimum, how would it affect global warming?
In one climate modelling experiment published in 2013, scientists explored the impact on global warming if a grand solar minimum strong enough to reduce total solar irradiance by 0.25% (a total solar irradiance decrease of 3.4 Watts per square meter) were to begin in 2025 and last through 2065. If greenhouse gas emissions proceed along a lower path (RCP 4.5) in the coming decades, a Maunder-like minimum might reduce the amount of global warming expected by 2065 by around 20%.
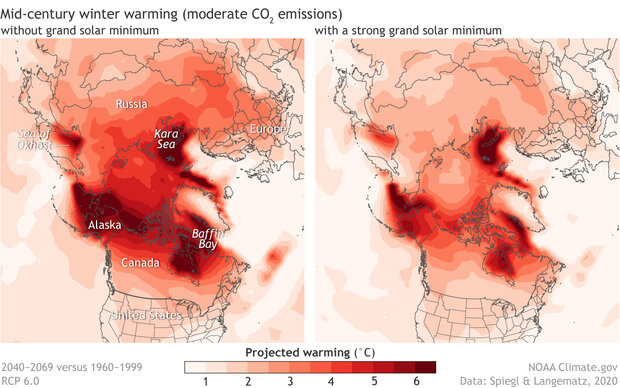
In a future with moderately high levels of greenhouse gases, large areas of the high northern latitudes could experience winter warming of at least 6 degrees Celsius (11 degrees Fahrenheit, left). A strong Grand Solar minimum could reduce but not eliminate this warming (right). NOAA Climate.gov image, based on data from Spiegl and Langematz, 2020.
Additional experiments have compared the impacts of grand solar minimums of different strengths with different emissions paths. For example, for a future in which greenhouse gases follow an intermediate pathway (RCP 6.0), one experiment found that a relatively weak Grand Solar Minimum, during which total solar irradiance dropped by 1.3 Watts per square meters for 5 decades in the middle of this century, could reduce global warming by 10%. To reach a 20% reduction in global warming, the Grand Solar Minimum would have to be very strong: sunlight at the top of the atmosphere would need to drop by nearly 6 Watts per square meter. A drop that large would significantly exceed what our current understanding of the Sun says is realistic.
On the whole, these and other studies find consistent results. While the Sun's influence is detectable in Earth's temperature records, the global-scale warming influence of human-produced greenhouse gases is likely to be far stronger than even a very strong Grand Solar Minimum.
Milankovitch cycles and ice ages
The 11-year sunspot cycle and its Gleissberg-cycle modulation cause small changes in the Sun’s actual brightness—how much sunlight the Sun radiates to Earth. Earth’s climate is also affected by how much sunlight reaches us due to changes in our planet’s orbit and position in space relative to the Sun. Called Milankovitch cycles, these predictable orbital patterns have repeat times of tens to hundreds of thousands of years.
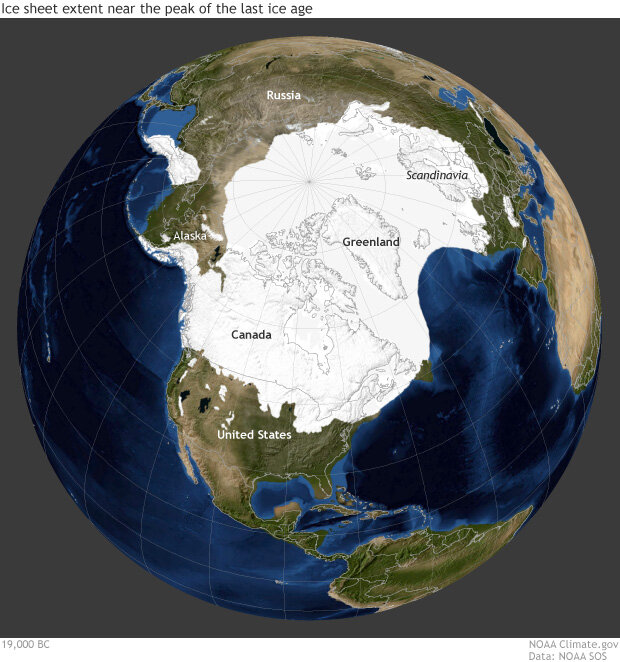
For the past million years at least, Milankovitch cycles have coincided with 100,000-year-long ice ages punctuated by short intervals of rapid warming. Although there are pieces of the puzzle experts still don’t understand, the key climate influence seems to be changes in the amount of incoming sunlight, or insolation, reaching the high latitudes of the Northern Hemisphere during the summer. The Northern Hemisphere is key to the ice ages because massive ice sheets can only grow over land, not ocean, and most of Earth’s land area has been concentrated in the Northern Hemisphere for at least tens of millions of years.
The most significant changes in Northern Hemisphere insolation come from three variations in Earth’s orbit:
- precession (~26,000 years): the slow rotation or “wobble” in the Earth’s axis of rotation, which changes where in the annual orbital path Northern Hemisphere summer solstice occurs;
- obliquity (~41,000 years): how tilted Earth’s axis of rotation is;
- eccentricity (~100,000 years): how far Earth’s orbit is from being a perfect circle.
Because these cycles have different lengths, they overlap in complex rhythms, reinforcing one another at some times and offsetting one other at others. Northern Hemisphere summer insolation is maximized when tilt is extreme, eccentricity is extreme, and precession causes Northern Hemisphere summer solstice to occur near perihelion, the place in its orbit when Earth is closest to the Sun. Summer insolation is minimized when tilt is smaller, eccentricity is extreme, and Northern Hemisphere summer solstice occurs near aphelion, when Earth is farthest from the Sun.

(Rows 1-3) Milankovitch cycles—variations in Earth's tilt on its axis, precession, and eccentricity—over the past million years. (Row 4) Incoming sunlight (insolation) during Northern Hemisphere summer. (Row 5) Global ice volume inferred from oxygen isotopes in sea floor sediments. The red line highlights conditions around 220,000 years ago, when overlap among the three orbital cycles brought a peak in Northern Hemisphere insolation, triggering a warming period with low ice sheet volume. NOAA Climate.gov image, based on data from Lisiecki and Raymo 2005 and Berger 1992.
How low summer insolation must fall to trigger an ice age depends on how high atmospheric carbon dioxide levels are; the more carbon dioxide, the lower the insolation must be. Looking back over the past million years, the highest carbon dioxide level at the start of any ice age was 300 ppm, and most were far lower.
Scientists have used these past relationships to help build Earth system models that can predict how low the summertime insolation would need to fall to trigger the next ice age. One modeling experiment hinted that Earth may have narrowly missed the initiation of a new ice age just before the start of the Industrial Revolution. Peak summer insolation was near an orbital minimum, and if atmospheric carbon dioxide levels had been 240 ppm instead of 280, ice sheets might have begun building up across parts of Alaska, Northern Canada, Iceland, and Scandinavia.
Yellow lines show changes in incoming sunlight in the Northern Hemisphere due to Milankovitch cycles over the next 500,000 years. (left panel) At pre-industrial levels carbon dioxide levels of around 280 parts per million (ppm), insolation must drop below about 455 watts/m2 (red line) to trigger an ice age, a threshold that will be reached around 50,000 years from now (blue snowflake). The higher the atmospheric carbon dioxide level, the lower the insolation has to fall to trigger an ice age, delaying the possibility for the next ice age by tens of thousands of years (center panel) or more (right panel). NOAA Climate.gov graphic, based on data from Archer and Ganopolski, 2005.
Another study estimated that at pre-industrial carbon dioxide levels, summer insolation at 65° North need only dip 0.75 standard deviations below the mean—about 15 Watts per square meter—for summers to be too cool to melt all the winter snow, a low that Milankovitch cycles predict we will next hit about 50,000 years from now. At 400 parts per million, summer insolation would need to fall twice as much—a low we will next see 125,000 years from now. At carbon dioxide levels above 560 parts per million, the study predicted, no Milankovitch variation within the next half million years will be low enough to trigger an ice age.
References
Archer, D., & Ganopolski, A. (2005). A movable trigger: Fossil fuel CO2 and the onset of the next glaciation. Geochemistry, Geophysics, Geosystems, 6(5). https://doi.org/10.1029/2004GC000891
Benestad, R. E. (2006). Solar Activity and Earth’s Climate. Springer Science & Business Media.
Coddington, O., Lean, J., Lindholm, D., Pilewskie, P., Snow, M., and NOAA CDR Program (2017): NOAA Climate Data Record (CDR) of Total Solar Irradiance (TSI), NRLTSI Version 2. NOAA National Centers for Environmental Information. doi:10.7289/V55B00C1 [Accessed June 5, 2025].
Feynman, J., and A. Ruzmaikin. (2014). The Centennial Gleissberg Cycle and its association with extended minima, J. Geophys. Res. Space Physics,119,6027–6041, doi:10.1002/2013JA019478.
Forster, P., T. Storelvmo, K. Armour, W. Collins, J. L. Dufresne, D. Frame, D. J. Lunt, T. Mauritsen, M. D. Palmer, M. Watanabe, M. Wild, H. Zhang, 2021, The Earth’s Energy Budget, Climate Feedbacks, and Climate Sensitivity. In: Climate Change 2021: The Physical Science Basis. Contribution of Working Group I to the Sixth Assessment Report of the Intergovernmental Panel on Climate Change [Masson-Delmotte, V., P. Zhai, A. Pirani, S. L. Connors, C. Péan, S. Berger, N. Caud, Y. Chen, L. Goldfarb, M. I. Gomis, M. Huang, K. Leitzell, E. Lonnoy, J.B.R. Matthews, T. K. Maycock, T. Waterfield, O. Yelekçi, R. Yu, and B. Zhou (eds.)]. Cambridge University Press. In Press.
Ganopolski, A., Winkelmann, R., & Schellnhuber, H. J. (2016). Critical insolation–CO 2 relation for diagnosing past and future glacial inception. Nature, 529(7585), 200–203. https://doi.org/10.1038/nature16494
Gulev, S. K., P. W. Thorne, J. Ahn, F. J. Dentener, C. M. Domingues, S. Gerland, D. Gong, D. S. Kaufman, H. C. Nnamchi, J. Quaas, J. A. Rivera, S. Sathyendranath, S. L. Smith, B. Trewin, K. von Shuckmann, R. S., Vose (2021). Changing State of the Climate System. In: Climate Change 2021: The Physical Science Basis. Contribution of Working Group I to the Sixth Assessment Report of the Intergovernmental Panel on Climate Change [Masson-Delmotte, V., P. Zhai, A. Pirani, S. L. Connors, C. Péan, S. Berger, N. Caud, Y. Chen, L. Goldfarb, M. I. Gomis, M. Huang, K. Leitzell, E. Lonnoy, J. B. R. Matthews, T. K. Maycock, T. Waterfield, 31 O. Yelekçi, R. Yu and B. Zhou (eds.)]. Cambridge University Press.
Hathaway, D. H. (2015). The Solar Cycle. Living Reviews in Solar Physics, 12(1), 4. https://doi.org/10.1007/lrsp-2015-4
Ineson, S., Maycock, A. C., Gray, L. J., Scaife, A. A., Dunstone, N. J., Harder, J. W., Knight, J. R., Lockwood, M., Manners, J. C., & Wood, R. A. (2015). Regional climate impacts of a possible future grand solar minimum. Nature Communications, 6(1), 7535. https://doi.org/10.1038/ncomms8535
IPCC, 2021: Summary for Policymakers. In: Climate Change 2021: The Physical Science Basis. Contribution of Working Group I to the Sixth Assessment Report of the Intergovernmental Panel on Climate Change [Masson-Delmotte, V., P. Zhai, A. Pirani, S. L. Connors, C. Péan, S. Berger, N. Caud, Y. Chen, L. Goldfarb, M. I. Gomis, M. Huang, K. Leitzell, E. Lonnoy, J.B.R. Matthews, T. K. Maycock, T. Waterfield, O. Yelekçi, R. Yu and B. Zhou (eds.)]. Cambridge University Press. In Press.
Lisiecki, L.E. and M.E. Raymo. 2005. A Pliocene-Pleistocene stack of 57 globally distributed benthic D18O records. Paleoceanography, 20, PA1003. doi: 10.1029/2004PA001071
Meehl, G. A., Arblaster, J. M., & Marsh, D. R. (2013). Could a future “Grand Solar Minimum” like the Maunder Minimum stop global warming? Geophysical Research Letters, 40(9), 1789–1793. https://doi.org/10.1002/grl.50361
Peristykh, A. N., & Damon, P. E. (2003). Persistence of the Gleissberg 88-year solar cycle over the last ∼12,000 years: Evidence from cosmogenic isotopes. Journal of Geophysical Research: Space Physics, 108(A1), SSH 1-1-SSH 1-15. https://doi.org/10.1029/2002JA009390
Rypdal, K., and Nilsen, T. (2016). Observations on Paleoclimate Timescales. In J. Lilensten, T. D. Wit, & K. Matthes (Authors), Earth's climate response to a changing Sun (pp. 130-138). Les Ulis, France: EDP Sciences.
Shakun, J. D., Clark, P. U., He, F., Marcott, S. A., Mix, A. C., Liu, Z., Otto-Bliesner, B., Schmittner, A., & Bard, E. (2012). Global warming preceded by increasing carbon dioxide concentrations during the last deglaciation. Nature, 484(7392), 49–54. https://doi.org/10.1038/nature10915
Spiegl, T., & Langematz, U. (2020). Twenty-First-Century Climate Change Hot Spots in the Light of a Weakening Sun. Journal of Climate, 33(9), 3431–3447. https://doi.org/10.1175/JCLI-D-19-0059.1
Solanki, S. K. (2002). Solar variability and climate change: Is there a link? Astronomy & Geophysics, 43(5), 5.9-5.13. https://doi.org/10.1046/j.1468-4004.2002.43509.x
Steinhilber, F., Abreu, J. A., Beer, J., Brunner, I., Christl, M., Fischer, H., Heikkilä, U., Kubik, P. W., Mann, M., McCracken, K. G., Miller, H., Miyahara, H., Oerter, H., & Wilhelms, F. (2012). 9,400 years of cosmic radiation and solar activity from ice cores and tree rings. Proceedings of the National Academy of Sciences, 109(16), 5967–5971. https://doi.org/10.1073/pnas.1118965109
Upton, L. A., & Hathaway, D. H. (2018). An Updated Solar Cycle 25 Prediction With AFT: The Modern Minimum. Geophysical Research Letters, 45(16), 8091–8095. https://doi.org/10.1029/2018GL078387
Usoskin, I. G. (2017). A history of solar activity over millennia. Living Reviews in Solar Physics, 14(1), 3. https://doi.org/10.1007/s41116-017-0006-9
Wang, Y.-M. and Lean, J. (2021) A New Reconstruction of the Sun’s Magnetic Field and Total Irradiance since 1700. The Astrophysical Journal (in press).