Climate Change: Annual greenhouse gas index
Among the most basic questions about global warming is how much are human-produced greenhouse gases influencing the climate today compared to the past? To answer this question, NOAA developed the Annual Greenhouse Gas Index ("AGGI" for short). Updated yearly, the AGGI calculates the combined warming influence of the most important long-lived greenhouse gases: carbon dioxide, methane, nitrous dioxide, and a number of industrial chemicals used in cooling and refrigeration, aerosol sprays, and other processes. The total direct heating influence in a given year is compared to conditions in 1990—the year that countries who signed the U.N. Kyoto Protocol agreed to use as a benchmark for their efforts to reduce emissions.
By the end of 2022, NOAA reported that the AGGI was 1.49, meaning the direct warming influence of human-produced greenhouse gases had risen 49 percent since 1990. Most of the warming influence (64 percent) is due to carbon dioxide. Methane is the second-largest contributor (19 percent). The third-largest contributor is the chlorofluorocarbons (CFCs) category (8.1 percent). (CFCs were widely used in cooling systems and aerosol sprays in the mid-1900s, before we realized they damaged the ozone layer. These substances and their replacements are now regulated under the Montreal Protocol, but they are extremely long-lived in the atmosphere, so they continue to play a role in Earth's heating imbalance.)
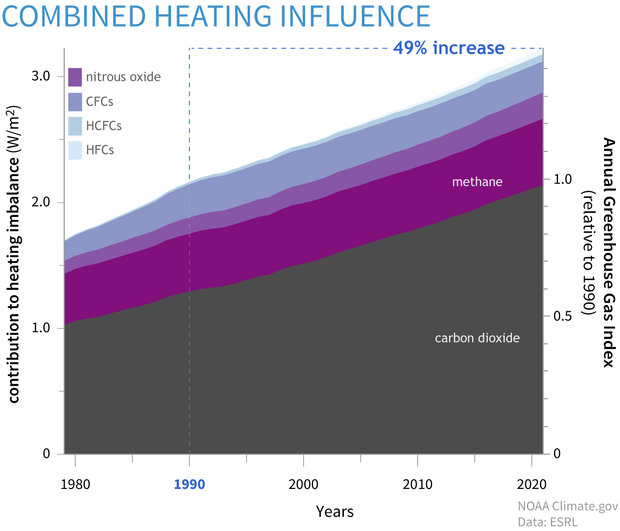
This graph shows the heating influence caused by the major human-produced greenhouse gases: carbon dioxide (gray), methane (dark purple), nitrous oxide (medium purple), chlorofluorocarbons (CFCs, lavender), hydrochlorofluorocarbons (HCFCs, blue), and hydrofluorocarbons (HFCs, light blue). Relative to conditions in 1750, today's atmosphere absorbs more than 3 extra watts of energy per square meter of Earth's surface. Graph by NOAA Climate.gov based on data from NOAA Global Monitoring Lab. For the complete list of chemicals in the CFC, HFC, and HCFC groups, see Figure 3 in the Full AGGI Report.Graph by NOAA Climate.gov based on data from NOAA ESRL.
Why greenhouse gases matter: the greenhouse effect
All gases that make up Earth’s atmosphere are largely transparent to incoming sunlight. Sunlight warms the ocean and land surfaces, and those sun-warmed surfaces radiate heat back into the atmosphere in response. The most abundant gases in the atmosphere, oxygen and nitrogen, are transparent to this outgoing heat (thermal infrared radiation), allowing it to travel freely out to space.
But greenhouse gases are not transparent to heat. They continually absorb heat energy and radiate it back into their surroundings—including back toward the Earth’s surface. Even after the Sun goes down, greenhouse gas molecules continue to radiate heat, like the bricks in a chimney radiate heat into a room even after a fire goes out.
The ability of long-lived greenhouse gases to absorb and radiate heat is the heart of Earth's natural greenhouse effect. Without them, Earth's average surface temperature would be below freezing instead of around 60 degrees Fahrenheit. Since the onset of the Industrial Revolution, human activities have been adding heat-trapping gases to the atmosphere. By adding extra greenhouse gases, we are amplifying the natural greenhouse effect and causing Earth's surface temperature to rise.
Change over time
Overall, since 1990, human-produced greenhouse gases have increased the heating power of the atmosphere by 1.11 Watts per square meter, according to the AGGI. Carbon dioxide is the big hitter, responsible for 78 percent of that increase. Changes methane and nitrous oxide—most of the latter comes from soil microbes when crops are overfertilized—are each responsible for about 7.5 percent of the increase. The remainder of the increase is from HCFCs and HFCs, each accounting for around 4 percent of the increase. The heating influence from the CFCs group has decreased over time as their manufacture slowed thanks to the Montreal Protocol.
Making the AGGI
Researchers in NOAA’s Global Monitoring Division calculate the AGGI using air samples collected every week at about 40 remote sites around the world. Technicians use state-of-the-art instruments to measure the abundance of greenhouse gases. From these observations, the researchers generate a smoothed global average. At the end of the year, the weekly data are combined into an annual average, which is then compared (indexed) to 1990. Indexing each year against 1990 makes it easier to compare one year to another.
The year 1990 was chosen as the baseline year because it marked the first time that countries around the world seriously considered how they might work together to reduce emissions of heat-trapping gases. Under the U.N. Kyoto Protocol, many industrialized nations around the world agreed to reduce their collective greenhouse gas emissions by about 5 percent of their 1990 amounts by 2012. Although the goals of this agreement have not been met, the year 1990 remains an important point of reference for efforts to limit greenhouse gas emissions.
NOAA researchers have also calculated AGGI values back to the year 1750—the onset of the industrial revolution. To accomplish this, they used data on greenhouse gases concentrations estimated from air bubbles trapped in ice cores collected at a network of sites around the globe. Using these historic data provide a more complete picture of humanity’s long-term influence on climate change. In the 2022 AGGI report update, experts from NOAA's Global Monitoring Lab wrote, "This longer-term view shows how increases in greenhouse gas concentrations over the past ~70 years (since 1950) have accounted for nearly three-fourths (71%) of the total increase in the AGGI over the past 270 years."
Reference
Montzka, S. (2022). The NOAA Annual Greenhouse Gas Index (AGGI). NOAA Global Monitoring Laboratory Website. Accessed April 30, 2023.
U.N. Framework Convention on Climate Change. (n.d.) The Greenhouse Effect. UCAR Center for Science Education Website. Accessed June 15, 2022.