Carbon Dioxide: Earth's Hottest Topic is Just Warming Up
High up on the northern flank of the Mauna Loa volcano in Hawai'i, Charles David Keeling began his monumental research task. Far away from polluting cities and high above the vegetation below, the bare landscape of the Big Island's "sleeping giant" offered a pure environment for learning about one of the most influential gases in Earth's atmosphere: carbon dioxide.
Scientists have been continuously monitoring and collecting data related to atmospheric change at the Mauna Loa Observatory since the 1950s.
That was more than fifty years ago, when Keeling was trying to determine precisely how much carbon dioxide is in the atmosphere. At that time, scientists were debating whether carbon dioxide released from the burning of fossil fuels would end up in the atmosphere or be fully absorbed by the ocean. The debate was sparked at the turn of the twentieth century, when Swedish scientist Svante Arrhenius suggested that human-produced carbon dioxide would build up in the atmosphere. He went even further to hypothesize that an accumulation of carbon dioxide in the atmosphere would gradually raise Earth's temperature.
Carbon-emitting fossil fuels – coal, oil and natural gas — currently provide more than 85% of all the energy consumed in the United States, nearly two-thirds of our electricity, and virtually all of our transportation fuels.
At that time, most scientists dismissed the idea that humans could significantly affect average global temperatures. Motivated by this scientific dispute, Keeling began taking measurements of carbon dioxide at Mauna Loa Observatory in 1958. His data collection project had the support of Harry Wexler of the U.S. Weather Service and Roger Revelle of the Scripps Institution of Oceanography.
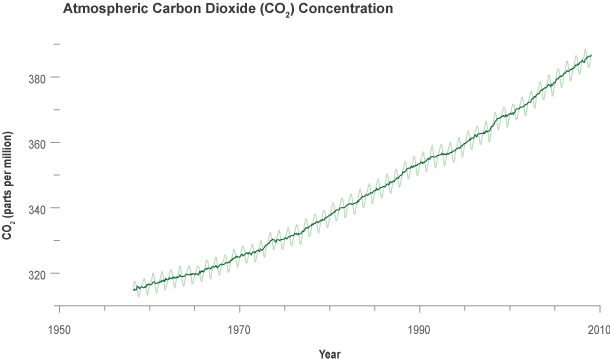
When he began taking measurements, Keeling was surprised to discover that carbon dioxide concentration peaked in May and then started declining! At first he feared his instrument was faulty. Then, when the carbon dioxide value reached a minimum in October and began climbing again, he realized that the rise and fall of carbon dioxide levels might be due to the regular seasonal cycle of growth and decay of plants. Sure enough, the measurements repeated the same pattern the following year.

Dr. Keeling points out the steady rise of carbon dioxide on a wall of graphs at the University of California, San Diego, Scripps Institution of Oceanography.
In June, as summer begins in the Northern Hemisphere, plants are actively removing carbon dioxide from the atmosphere for photosynthesis-the process by which they use sunlight energy to convert carbon dioxide, water, and nutrients into leaves and other plant materials. Consequently, the amount of carbon dioxide in the atmosphere goes down. When fall arrives, many plants die or go dormant; they reduce their uptake of carbon dioxide, and decay of their dead leaves increases the amount of carbon dioxide they release to the air. The yearly "wobbles" in the Keeling Curve reflect this seasonal cycle of plant growth.
Keeling made another big discovery early on. He noticed that the average concentration of carbon dioxide in 1959 was higher than the previous year. The average for 1960 was higher still. Over the years, Keeling continued gathering measurements in Hawai'i and expanded his sampling program to other locations around the world, including the South Pole. Year after year at all locations, the average carbon dioxide concentrations continued to rise. Keeling and others concluded that the oceans were not absorbing all the carbon dioxide produced by the burning of fossil fuels. Rather, carbon dioxide was accumulating in the atmosphere.
Today, scientists continue to monitor and analyze carbon dioxide levels in the atmosphere. All data show a continuing rise in carbon dioxide at an increasing rate. The vast majority of scientists are now very confident that humanity's ever-accelerating production of carbon dioxide from the burning of fossil fuels and deforestation is causing the concentration of the gas in the atmosphere to climb to higher peaks with each passing year.
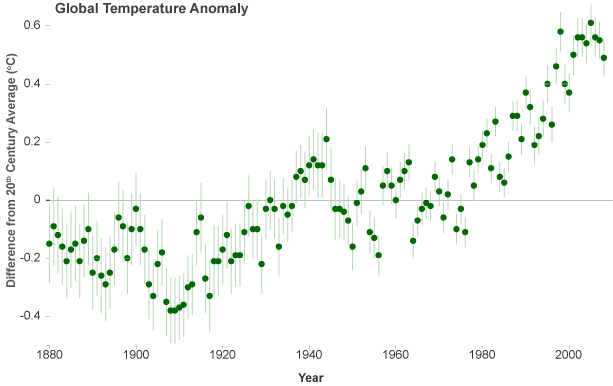
Human emission of billions of tons of carbon dioxide every year is sometimes referred to as humanity's "uncontrolled experiment on the climate system." Whether for good or ill, the experiment has convinced an international panel of climate experts that Arrhenius' hypothesis was right: the increased abundance of carbon dioxide is slowing the rate at which heat escapes through the top of Earth's atmosphere. Observations have confirmed that the warming of the climate is unequivocal. Since 1900, the global average temperature has risen about 1.5°F, with the most substantial increases occurring since 1970. The U.S. average temperature has risen by a comparable amount and is very likely to rise more than the global average over this century, with some variation from place to place.
Monitoring Carbon Dioxide Around the Globe
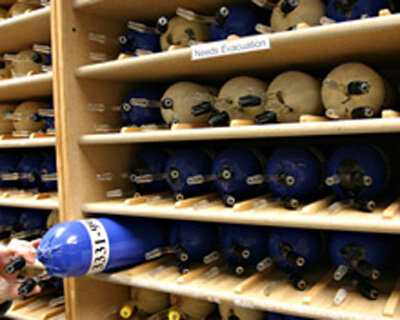
NOAA’s Earth System Research Laboratory in Boulder, Colorado stores approximately 6,000 flasks. The flasks travel all over the world to be filled with air samples for global atmospheric monitoring.
Every week, across a network of monitoring stations on every continent, researchers capture air in dry and clean glass or metal flasks and then ship them to laboratories for analysis. Scientists then measure the concentrations of trace gases, which exist in very small amounts. The composition of the atmosphere is approximately 21 percent oxygen, 78 percent nitrogen, and 1 percent argon. The remaining less than one percent consists of trace gases, some of which are greenhouse gases like carbon dioxide, methane, and nitrous oxide.
In the labs, sensitive instruments measure carbon dioxide in parts per million (ppm). The instruments also measure the presence of other greenhouse gases and pollutants at concentrations of parts per billion (ppb), and even parts per trillion, a million times a million (ppt). A concentration of one part per million is similar to finding one orange hidden among all the apples contained in 2,000 barrels.
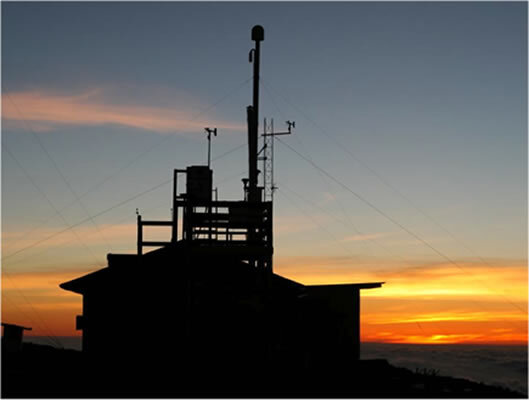
A bit higher up, instruments mounted on a network of television, radio, and cell phone towers continuously monitor greenhouse gas concentrations from both natural sources and fossil fuel emissions, which contribute to climate change. Sampling air at heights several hundred meters above the ground avoids some of the dust and other contaminants below, and makes the measurements representative of a larger area.
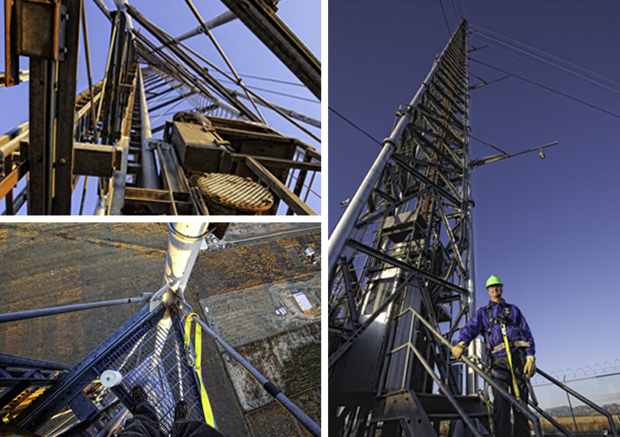
Earth System Research Laboratory scientist Dan Wolfe dons his safety hat and climbing harness before boarding the elevator for the 5 minute ride to the top of the Boulder Atmospheric Observatory (BAO) in Erie, Colorado. The top left photo shows the view from the bottom of the 300 meter (985 feet) tower, and the bottom left photo shows a view of the countryside below. The BAO tower is just below the height of the Eiffel Tower.
The towers are located in several parts of the country and each show regionally representative measurements of carbon dioxide and related gases. Currently, there are eight towers in use but plans call for the addition of six more towers distributed throughout the continental US over the next several years. Data from NOAA's network of "tall towers" helps state and local governments measure their efforts at reducing carbon emissions. This information will be important in defining policies aimed at lowering the human contribution to the greenhouse effect and climate change.
To obtain more detailed and uncontaminated measurements of greenhouse gases, scientists travel to observatories in remote locations far from any pollution sources. Four important observatories are located in Barrow, Alaska; Mauna Loa, Hawaii; American Samoa; and the South Pole, Antarctica. The Mauna Loa Observatory, for example, is a prime spot for sampling Earth's background air due to its remote location in the Pacific Ocean, high altitude (3397 meters, or 11,135 feet above sea level), and great distance from polluting cities. The observatory is located above the strong temperature inversion layer in the atmosphere that separates the more polluted lower portions of the atmosphere from the much cleaner air above.
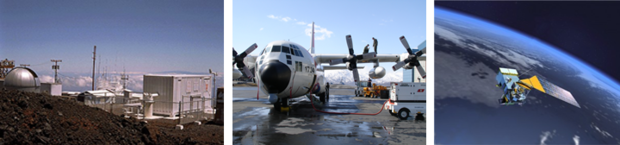
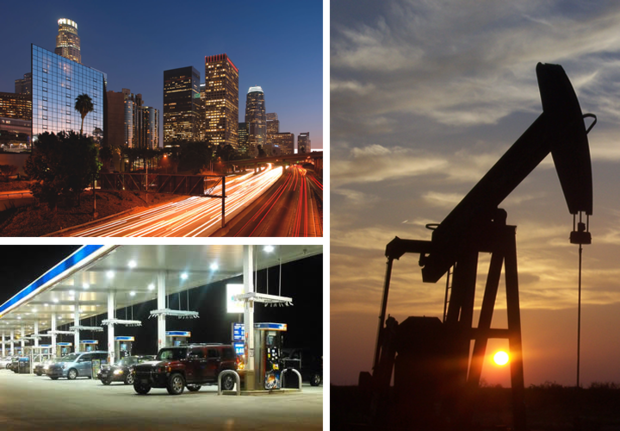
To monitor the movement of carbon dioxide high up in the atmosphere, scientists deploy aircraft and satellites with instruments to record where carbon dioxide is coming from and where it is going (photos at center and right). The Mauna Loa Observatory (photo at left) provides uncontaminated measurements of carbon dioxide at a high-altitude location on the side of an active volcano.
The largest gap in the greenhouse gas global monitoring system is the lack of regular measurements of the vertical profile of gases such as carbon dioxide over continental areas. To obtain these measurements, a system is used aboard small aircraft that automatically collects air samples at different levels of the atmosphere during the flight. Even higher up, satellite-based instruments collect information about carbon dioxide concentration at a range of levels in the atmosphere.
Carbon Sources and Sinks
In addition to measuring atmospheric concentrations of carbon dioxide, scientists collect data to learn where and how much carbon dioxide is entering and leaving the atmosphere. Because oceans and growing plants absorb more carbon dioxide than they emit, they are called carbon sinks. Conversely, a carbon source is any place or process that releases carbon dioxide into the atmosphere. One of the largest carbon sources is the decay of dead plants and animals: as microorganisms break down previously living material, they release carbon dioxide into the air. Other natural carbon sources include forest fires and volcanoes.
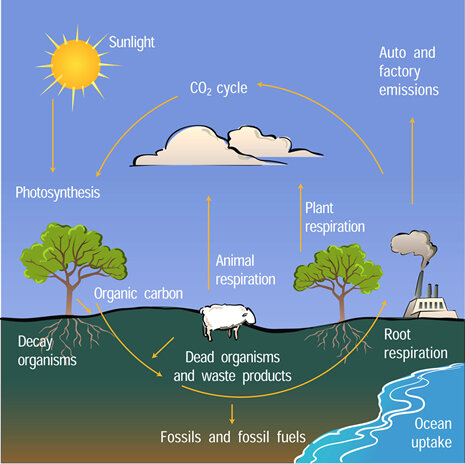
The carbon atom is an essential building block of all living organisms. Carbon constantly moves through all living things, as well as through the oceans, atmosphere, and Earth’s crust. For example, carbon moves from air to vegetation through photosynthesis. Decaying plant tissue adds carbon to soils, and soil organisms digest and release carbon dioxide back into the atmosphere.
Natural carbon sources are nearly balanced by natural carbon sinks. The life processes of vegetation, animals, and microbes release around  55 billion tons of carbon in the form of carbon dioxide into the atmosphere per year. The ocean releases an additional 90 billion tons. Over a year, vegetation and ocean water also absorb about the same amount of carbon dioxide from the atmosphere. As a result of this natural equilibrium, carbon dioxide levels in the atmosphere have shown very little change during the last 10 thousand years before human activities started adding an additional amount each year.
The largest source of manmade carbon dioxide is the combustion of fossil fuels. Humans use coal, oil, and gas to produce electricity, to run industrial facilities, and to power transportation and other appliances. A number of industrial production processes such as refining minerals, processing metals, and manufacturing petroleum-based products release significant amounts of carbon dioxide. Permanent removal of standing forests-commonly known as deforestation-is also responsible for considerable carbon dioxide emissions. Carbon that was sequestered in trees is released to the atmosphere when they burn or decay, and these emissions are not counter-balanced by carbon dioxide absorption that would occur with the re-growth of new trees.
Human emissions of carbon dioxide are small compared to those of natural carbon sources. In 2008, fossil fuel carbon dioxide emissions contributed about 8.7 billions tons of carbon to the atmosphere per year, and this number continues to rise. Land use change was responsible for estimated net emissions of 1.5 billion tons of carbon per year over the last 15 years. Natural processes on land and in the oceans have helped to slow the gradually accelerating emission rate by removing 57 percent of carbon dioxide, or 5.3 billion tons of carbon per year, emitted from human activities from 1958-2008. However, the continual addition of more carbon dioxide to the atmosphere is exceeding the ability of carbon sinks to absorb it. As a result, carbon dioxide is accumulating in the atmosphere. Due to human activities, the present carbon dioxide concentration of about 387 ppm is more than 35 percent above its highest level over at least the last 800,000 years.
How do we know that rising carbon dioxide levels are linked to human activity?
Since the beginning of the industrial revolution, people have been burning fossil fuels to generate electricity, power machines for manufacturing and transportation, and heat homes and offices. Comparisons of historical records of fossil fuel utilization with changes in atmospheric carbon dioxide concentration show a close correlation between the two. Though correlation alone does not indicate causation, the amount of carbon dioxide emitted by other sources such as volcanoes or forest fires is not sufficient by a large margin to account for the measured increase.
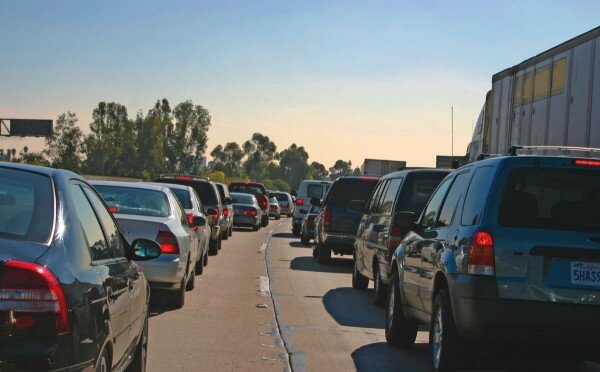
Emissions from an individual car are generally low, relative to the smokestack image many people associate with air pollution. But in numerous cities across the country, the personal automobile is the single greatest polluter, as emissions from millions of vehicles on the road add up. Driving a private car is probably a typical citizen’s most “polluting” daily activity.
Another line of evidence that points to humans as the source of the increase in carbon dioxide comes from studying the subtle differences among carbon atoms. The nuclei of carbon atoms in carbon dioxide emitted by burning fossil fuels differ slightly from the nuclei of carbon atoms that are part of the carbon dioxide emitted by decaying plants and the ocean. Scientists can use these differences to distinguish the source of carbon in air samples.

Tree rings reflect changes such as drought, precipitation and temperature during the life of a tree. By examining wood from trees in different locations and from different time periods, scientists can maintain a continuous record of climate changes over a few thousand years. Photo courtesy of H.D. Grissino-Mayer, University of Tennessee.
Coal, oil, and natural gas are formed from plant materials that were buried millions of years ago. Over time, the very small number of the plants' carbon nuclei that were once radioactive (carbon-14) have all decayed to non-radioactive nitrogen. In contrast, the carbon dioxide emitted by living organisms and by the oceans has close to the same number of radioactive carbon-14 atoms as the atmosphere. As the amount of atmospheric carbon dioxide has increased since the industrial revolution the fraction of radioactive carbon atoms it contains has decreased. This shows that the additional carbon dioxide in the atmosphere must be coming from a source with no radioactive carbon: fossil fuels.
Direct evidence of the atmosphere's decreasing fraction of radioactive carbon-14 comes from tree rings. As trees incorporate available carbon dioxide into their structure each year, tree-rings have preserved a precise record of the decreasing fraction of radioactive carbon atoms in the air. Along with the correlation between the amounts of fossil fuels that have been burned over time and increases in atmospheric carbon dioxide, these studies point directly to human activities as the cause of increased carbon dioxide in the atmosphere.
The 2007 Report of the Intergovernmental Panel on Climate Change, after reviewing numerous scientific papers on this matter, stated that "Most of the observed increase in global average temperatures since the mid-20th century is very likely (meaning a 90% or greater probability) due to the observed increase in anthropogenic greenhouse gas concentrations."
Earth's Natural Records of Carbon Dioxide
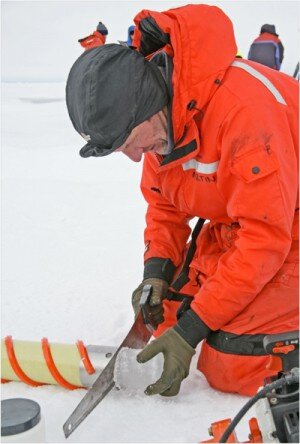
A scientist saws through an ice core to obtain air samples, which are later analyzed for their carbon dioxide content. Photo courtesy of NOAA.
In a lucky accident for modern scientists, nature has stored a vast collection of air samples that can tell us how atmospheric carbon dioxide has changed over time. Layers of snow have accumulated on Antarctica and Greenland over hundreds of thousands of years, trapping small pockets of air between the grains of snow. New layers of snow accumulate each year, compressing older, lower layers into ice, trapping the samples as tiny air bubbles within the ice. Today, when scientists drill into the ice sheets with a hollow tube, they remove long cylinders of ice called ice cores. Scientists extract air from the bubbles and analyze it to measure the composition of gases that were in the atmosphere when each layer of snow fell. Ice cores have yielded records of carbon dioxide and other gases going back more than half a million years.
Clues from ice cores and a variety of other natural records including tree rings, lake bottoms, swamp bottoms, sea bottoms, and coral samples have helped scientists reconstruct a timeline of global climate in Earth's past. Evidence shows that over the course of geological time, Earth has experienced large swings in climate. Some of these were caused by subtle changes in Earth's orbit around the Sun and amplified by feedbacks in the carbon cycle and climate system.
Over the past 400 thousand years, there were four cycles of glacial advance and retreat, with the last ice age ending abruptly about eleven thousand years ago. These large swings in climate were roughly parallel to fluctuations in carbon dioxide levels. During this time, carbon dioxide levels ranged from about 180 and 280 parts per million roughly every 100 thousand years.
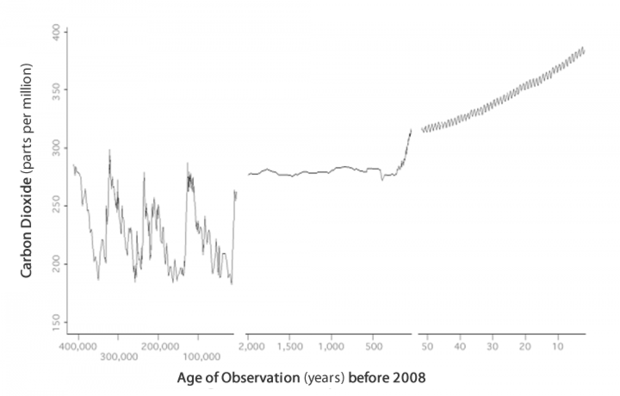
Carbon dioxide records for the past 400,000 years include reconstructed concentrations derived from ice cores in Antarctica and observed measurements from the last five decades. Graph based on three datasets – Lake Vostok (from about 400,000 years ago to 2,500 years ago), Law Dome Ice Core (from 2,000 years ago to 25 years ago), and the Mauna Loa Record (from 25 years ago to 2008).
In recent centuries, carbon dioxide levels have risen sharply. Scientists anticipate this rate of increase will continue rising until humans reduce their use of fossil fuels for energy. Some of the worst-case scenarios project that our atmosphere's carbon dioxide concentration will rise from its current level of 387 ppm to nearly 1,000 ppm by 2100! Our knowledge of Earth's past can provide some clues for determining how regional climates may behave in response to the increasing levels of atmospheric carbon dioxide anticipated in the future.
Carbon Dioxide's Role In Earth's Energy Budget
On a clear summer day, the temperature of rocks, plants, and buildings exposed to sunlight begins to increase soon after sunrise. That's because most of the sunlight absorbed at Earth's surface is stored as heat. Throughout the day and into the evening, this heat radiates out from the surfaces that absorbed it. Some of the heat escapes directly to space, but some of it is absorbed by gases in the atmosphere and then re-radiated back toward Earth's surface.
More than 99 percent of the molecules in Earth's atmosphere are nitrogen and oxygen. These molecules are essentially oblivious to heat radiation-they cannot absorb the heat radiated by the earth surface, and neither do they absorb visible light from the sun. On the other hand, the atmospheric molecules known as greenhouse gases absorb heat energy very efficiently. These gases, which make up less than one percent of the atmosphere, absorb heat energy and then re-emit it in all directions, including back toward Earth's surface, causing further warming of the surface. The result of these energy interactions is a warm atmosphere surrounding our planet. Though greenhouse gases are only minor ingredients in Earth's atmosphere, they regulate our climate. Without their warming effect, our world would be a frigid place-inhospitable to many of the life forms it currently supports.
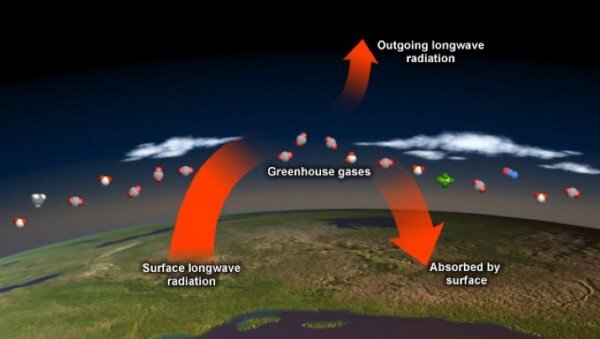
Greenhouse gas molecules re-radiate heat in all directions, toward space and back down toward Earth’s surface. Increasing greenhouse gases trap more heat in the atmosphere.
So why does carbon dioxide get so much attention? The added carbon dioxide molecules (and their warming influence) will remain in the atmosphere and ocean system for thousands of years. Greenhouse gases such as methane and nitrous oxide absorb and release more heat per molecule than carbon dioxide, but their overall warming influence is smaller because their concentrations are much lower. Further, because they react with other molecules more readily than carbon dioxide, they are always slowly destroyed in the atmosphere.
Human activities such as burning fossil fuels and clearing vegetation have increased the concentration of carbon dioxide and of other greenhouse gases in the atmosphere. The observed change in atmospheric composition has increased the capacity of Earth's atmosphere to retain heat. The additional heat energy trapped in the atmosphere is a major driver of global climate change.
Cutting Down on Carbon

Coral reefs and the organisms that they support will be affected by ocean acidification. Photo courtesy of Florida Keys National Marine Sanctuary.
Looking ahead, the global warming consequences of human carbon dioxide emissions have increasing potential to impact our health and economy. If humanity proceeds on a business-as-usual path through the 21st century, scientists predict that our emissions of carbon dioxide will cause further warming in the future, and at an accelerating rate. All climate models project that human-caused emissions of heat-trapping gases will cause further warming in the future. Based on scenarios that do not assume explicit climate policies to reduce greenhouse gas emissions, global average temperature is projected to rise by 2 to 11.5°F by the end of this century (relative to the 1980-1999 time period). Whether we end up on the high or low end of this range depends on if, when, and how much we reduce carbon dioxide emissions, and how the climate system responds to the change.
We are already observing changes in the U.S. These include increases in air and water temperatures, reduced frost days, increased frequency and intensity of heavy downpours, a rise in sea level, and reduced snow cover, glaciers, permafrost, and sea ice. These climate-related changes are expected to intensify while new ones develop. Likely future changes for the U.S. and surrounding coastal waters include more intense hurricanes with related increases in wind, rain, and storm surges (but not necessarily an increase in the number of storms that make landfall), as well as drier conditions in the Southwest and Caribbean.
Increasing atmospheric carbon dioxide could have deadly consequences for many species of marine organisms. About half of the carbon dioxide produced by humans since the industrial revolution has been absorbed into the ocean. This has changed the ocean's chemistry, making it more acidic. As water in parts of the ocean becomes more corrosive, shell-forming organisms have trouble making their shells, and they must either move to other regions, or die. These creatures are the base of the food chain for many marine species; their decline could ultimately threaten a reorganization of the entire marine food chain, which would almost certainly result in a mass extinction event.
Climate-related changes will affect the water supply, food production, human health, habitability of coastal areas, and many other aspects of society and the natural environment. If humanity chooses to stabilize or even reduce atmospheric carbon dioxide, we will need to develop cost-effective strategies for doing so. Most scientists, engineers, and economists agree that there is likely no single strategy that can stabilize or reduce human carbon dioxide emission. There is widespread agreement that we will need to make some changes on both an individual and large-scale level.
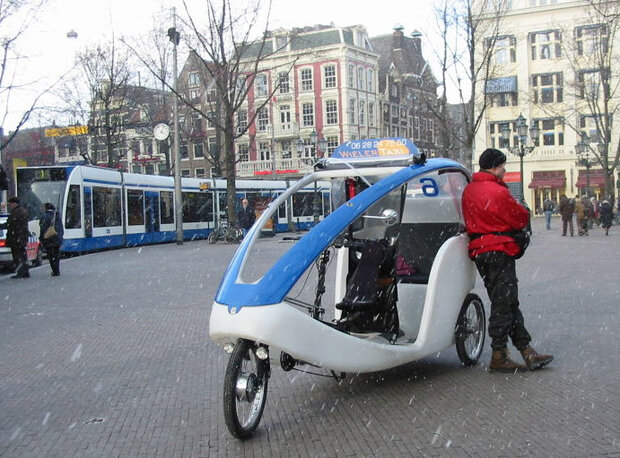
In Amsterdam, citizens can ride the train or bicycle taxis to make their way through the city. Both options are environmentally friendly because they reduce the amount of carbon-emitting automobiles on the road.
As individuals, we can:
Take steps to increase the energy efficiency of our cars, homes, and power plants by adjusting our thermostats, adding insulation, driving fewer miles, maintaining proper tire pressure, etc.
Recycle, because every product requires energy, and thus emissions, to produce and transport.
Address the supply-and-demand part of the problem by using our consumer spending power wisely. Buying green products and replacing old appliances with new ones that have an "energy star" rating are two good ways consumers can positively influence the free market while lowering energy consumption.
ENERGY STAR is a government-backed program helping businesses and individuals protect the environment through superior energy efficiency.
On the national and international level, policy leaders can explore options to:
Capture the carbon emitted by power plants and other human sources, and store it underground.
Provide incentives to help fossil fuel-burning power plants lower or eliminate their carbon emissions.
Meet an ever-increasing percentage of our energy needs using alternative, non-carbon-producing sources-including nuclear, solar, wind, hydroelectric, and bio-fuels.
Halt deforestation and soil degradation worldwide, while reforesting more areas.
While a large-scale adoption of these strategies will come at a cost, climate scientists and economists agree that the longer-term cost of inaction will be much greater.
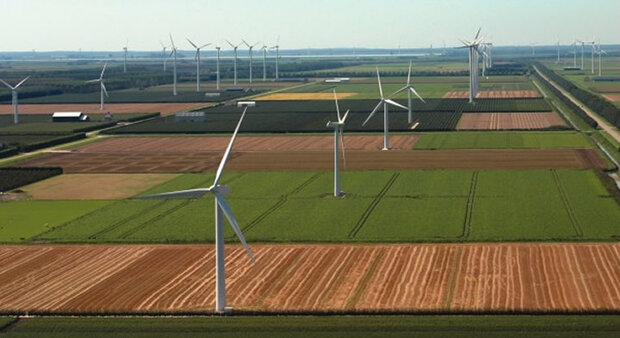
The renewable energy industry is on the look-out for technologies that may provide affordable solutions for global warming.
Can we muster the collective will to reduce carbon dioxide in the atmosphere and, if we do, how the climate system will respond. Meanwhile, climate scientists caution that continuing to emit carbon dioxide in today's "business-as-usual" approach will likely lead to a condition of "dangerous human interference" in the global climate system, with negative consequences for life on Earth and the stability of our civilization.
References & Additional Reading
Introduction
Keeling, C.D. "The Concentration and Isotopic Abundances of Carbon Dioxide in the Atmosphere." Tellus, 12, 200-203, 1960.
Intergovernmental Panel on Climate Change. (2007). Climate Change 2007: The Physical Science Basis Summary for Policymakers, A Report of Working Group I to the Fourth Assessment Report of the Intergovernmental Panel on Climate Change.
Mann, M. and L.R. Kump, 2008: Dire Predictions: Understanding Global Warming. DK Publishing, Inc.: New York, New York.
Scripps CO2 Program. Program History.
Monitoring Carbon Dioxide Around the Globe
Earth System Research Laboratory. GMD Carbon Cycle Greenhouse Gases Group (CCGG).
NOAA Celebrates 200 Years. Life of an Air Flask.
Carbon Sources and Sinks
Earth System Research Laboratory. Carbon Cycle Science.
Earth System Research Laboratory. CarbonTracker.
Environmental Protection Agency. Carbon dioxide.
Intergovernmental Panel on Climate Change. (2007). Climate Change 2007: The Physical Science Basis, A Report of Working Group I to the Fourth Assessment Report of the Intergovernmental Panel on Climate Change.
Mann, M. and L.R. Kump, 2008: Dire Predictions: Understanding Global Warming. DK Publishing, Inc.: New York, New York.
U.S. Global Change Research Office. “Common Questions About Climate Change” by the United Nations Environment Programme – World Meteorological Organization.
Earth's Natural Records of Carbon Dioxide
Earth Observatory. Global Warming.
Earth Observatory. Paleoclimatology: The Ice Core Record.
Earth System Research Laboratory. Trends in Atmospheric Carbon Dioxide – Mauna Loa.
Intergovernmental Panel on Climate Change. (2007). Climate Change 2007: The Physical Science Basis Summary for Policymakers, A Report of Working Group I to the Fourth Assessment Report of the Intergovernmental Panel on Climate Change.
Data Download
Lake Vostok (from about 400,000 years ago to 2,500 years ago)
Law Dome Ice Core (from 2,000 years ago to 25 years ago)
Mauna Loa Record (from 25 years ago to 2008)
Carbon Dioxide's Role in Earth's Energy Budget
Earth Observatory. Climate and Earth’s Energy Budget.
Earth System Research Laboratory. Greenhouse Gases: Frequently Asked Questions.
Intergovernmental Panel on Climate Change. (2007). Climate Change 2007: The Physical Science Basis Summary for Policymakers, A Report of Working Group I to the Fourth Assessment Report of the Intergovernmental Panel on Climate Change.
Cutting Down on Carbon
Global Climate Change Impacts in the United States.
Carbon Dioxide Information Analysis Center. Recent Greenhouse Gas Concentrations.
Earth Observatory. Global Warming.
Earth System Research Laboratory. Carbon Cycle Science.
Intergovernmental Panel on Climate Change. (2007). Climate Change 2007: Mitigation of Climate Change Summary for Policymakers, A Report of Working Group III to the Fourth Assessment Report of the Intergovernmental Panel on Climate Change.
Intergovernmental Panel on Climate Change. (2007). Climate Change 2007: The Physical Science Basis Summary for Policymakers, A Report of Working Group I to the Fourth Assessment Report of the Intergovernmental Panel on Climate Change.
NOAA State of the Science Fact Sheet – Ocean Acidification. May 2008.