2013 State of the Climate: Humidity
Why It Matters
A variety of gases contribute to Earth’s natural greenhouse effect, including methane, carbon dioxide, and water vapor. In addition to helping regulate the Earth’s surface temperature, water vapor is also a key stage of the water cycle, ferrying water and heat through the atmosphere from one place on Earth to another. On an everyday level, the amount of water vapor in the air—the humidity—influences how hot and sticky the air feels and how hard an air conditioner has to work for us to feel cool.
Conditions in 2013
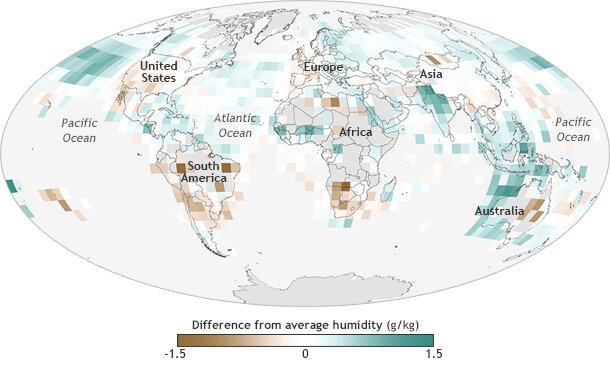
Specific humidity(amount of water vapor in the air) in 2013 compared to the 1981-2010 average. Shades of green indicate places where the air contained up to 2 grams more water per kilogram of air than usual, while rusty brown indicates lower-than-average amounts of water vapor. NOAA map Dan Pisut, based on blended NOCSv2.0 (oceans) and HadISDH (land) data. Adapted from Plate 2.1(f) in State of the Climate in 2013.
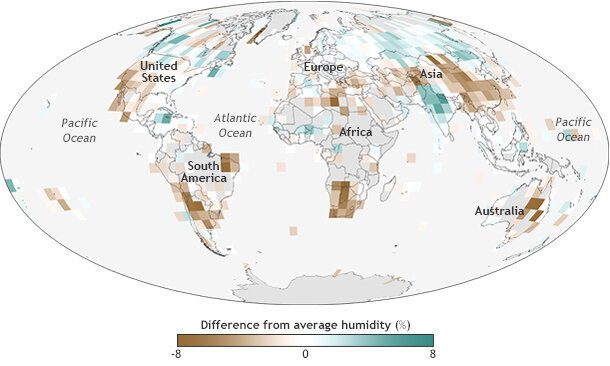
Relative humidity (how close the air is to being saturated with water vapor) over land in 2013 compared to the 1981-2010 average. Shades of green indicate places where the air was up to 8 percent more saturated (wetter) than average, while rusty brown indicates the air was up to 8 percent less saturated (drier) than average. NOAA map Dan Pisut, based on HadISDH data. Adapted from Plate 2.1(g) in State of the Climate in 2013.
Overall, there was more water vapor than average in the near-surface atmosphere in 2013. The air over the southern and central United States, western Europe, central and east Asia, central South America, southern Africa, and central eastern Australia were drier than the 1981-2010 average. But overall, most regions experienced moister-than-average atmospheric conditions including the midlatitude northern Pacific and northern Atlantic, Southeast Asia, and most of tropical Africa.
While the specific humidity—the amount of water vapor–was well above average over land and ocean, the relative humidity—how close the air is to being completely saturated with water vapor—was far below average in 2013, although slightly higher than in 2012. In 2013, below-average saturation dominated midlatitude land masses, whereas the higher latitudes and tropics, especially India, had higher relative humidity than the long-term average. Differences were much greater over land than over the oceans.
Change Over Time
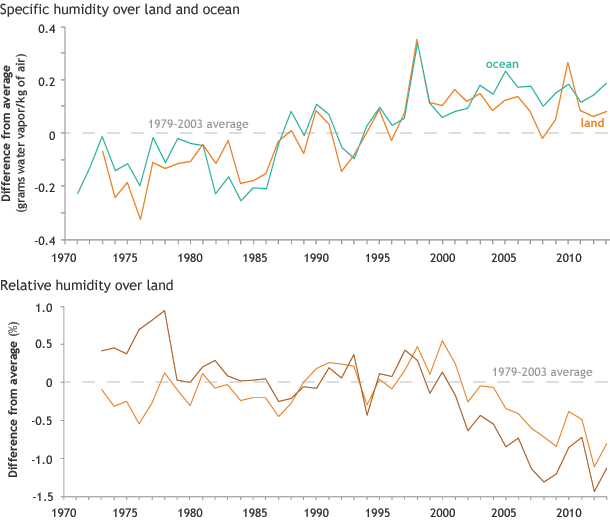
(top) Annual specific humidity over land (orange) and ocean (green) compared to the 1979-2003 average. (bottom) Relative humidity over land areas compared to the 1979-2003 average from two different data sets. While the exact values form the the different sources vary from year to year, most show similar trends over time. Graph by NOAA Climate.gov, adapted from Figure 2.12 in State of the Climate in 2013.
Overall, water vapor in the surface atmosphere has increased over land and ocean relative to the 1970s (specific humidity is rising), while the atmosphere over land is becoming less saturated (relative humidity is dropping). At first glance, that seems impossible. How can the atmosphere be getting less saturated if there is more water vapor in the air?
The drivers of this are not yet well understood but differences in rate of warming between land and ocean, and land surface water availability may be factors. Saturation—the point at which water vapor condenses back into water or ice, often forming clouds—depends on the air temperature, and air temperature around the world is also rising. Over many land areas, it’s getting warmer faster than it is getting wetter, which means the air is less saturated (relative humidity goes down), even as specific humidity goes up.
Reference
K. Willett, A. Simmons, and D. Berry, 2014: [Global climate] Surface humidity [in “State of the Climate in 2013”]. Bull. Amer. Meteor. Soc., 93 (7), S19–S20.