Updated Climate Explorer now offers projections for the entire United States
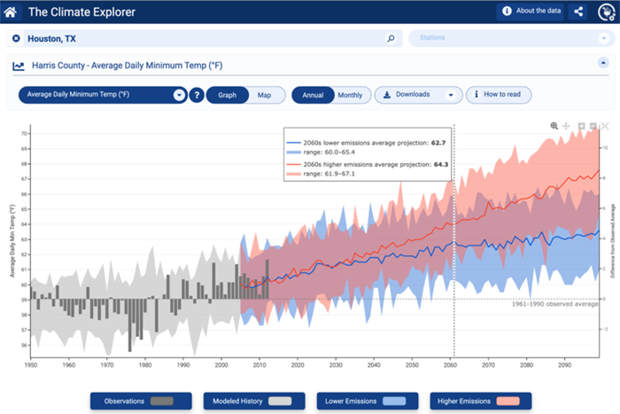
This screenshot gives a sample of data available from the Climate Explorer. Credit: NOAA
The latest version of the U.S. Climate Resilience Toolkit’s Climate Explorer now offers climate projections for every county in the entire United States. The recent addition of climate projection data for Hawai'i and U.S. island territories in the Pacific Ocean and Caribbean Sea complements the tool’s original contiguous U.S (CONUS) coverage and the addition of data for Alaska in 2020.
New features in the recent update help users read the tool’s graphs and maps to understand conditions projected for future decades. The graphs in the tool now feature dynamic display of values under the user’s cursor. To encourage appropriate use of data, the tool displays decadal averages of projections rather than annual values. Additionally, the map interface lets users make visual comparisons of past and projected conditions for two scenarios. Users can click any county in the maps to see summary statistics for color-coded variables shown on the maps.
Read more at the link below.