Texas temperature dashboard now available
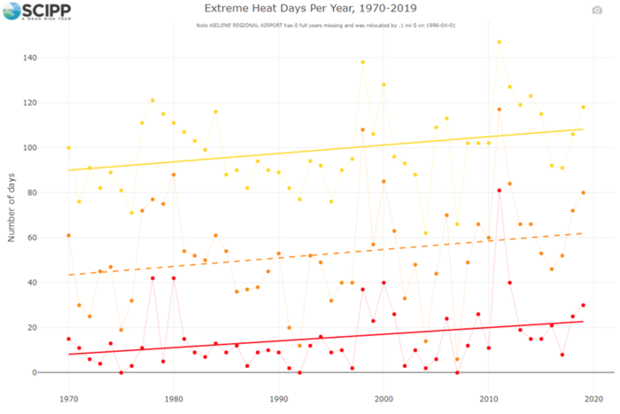
The temperature dashboard shows changes in the number of extreme-heat days per year. Credit: SCIPP
This month, the Southern Climate Impacts Planning Program (SCIPP), a NOAA Climate Program Office Regional Integrated Sciences and Assessments (RISA) team, in collaboration with Texas Sea Grant, released a new dashboard that shows historical trends in temperatures for locations across the state of Texas. While other resources exist that present regional or national trends in temperatures, few tools provide such information on a local level. This dashboard helps to fill that gap, offering location-specific information about changes in temperature in the last 50 years.
The dashboard presents trends in extreme heat, extreme cold, warm nights, heating and cooling degree days, seasonal average temperatures, seasonal extreme temperatures, and yearly average temperatures from 1970-2019 for 75 stations (point locations) in Texas. The graphs show both individual data points for each year and overall trend lines and can be downloaded as images. The dashboard also includes a link to a fact sheet discussing the temperature indicators shown in the tool and their importance.
Read more at the link below.