Tropical Pacific continued to cool in June 2016
Details
The tropical Pacific Ocean is at the heart of ENSO. Short for El Niño-Southern Oscillation, ENSO is a natural climate pattern in which the central/eastern tropical Pacific swings back and forth between a warm and rainy state (El Niño) and a cooler and drier state (La Niña). El Niño and La Niña disrupt wind, air pressure, and rainfall patterns throughout the tropics. The disruptions can have side effects on global climate, including shifting the location of the mid-latitude jet streams that guide storms towards the United States.
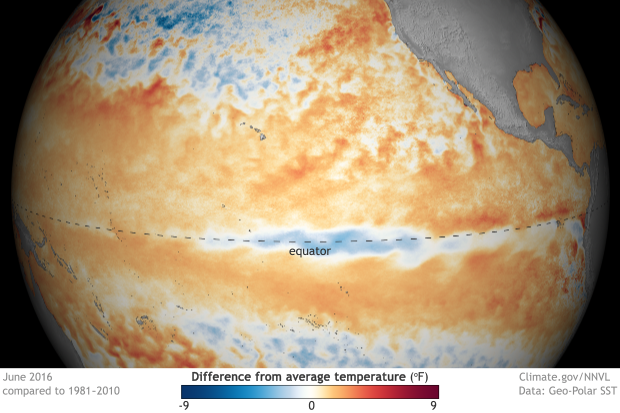
To predict El Niño and La Niña, climate forecasters pay careful attention to the sea surface temperatures in the tropical Pacific Ocean. The map at right shows where average sea surface temperatures in June 2016 were warmer (reddish colors) or cooler (bluish colors) than the 1981-2010 average: the darker the color, the larger the departure from average.
The warm waters that dominated the central and Eastern tropical Pacific while El Niño was underway in 2015 have faded. parts of the area are even cooler than they were in May. NOAA forecasters declared El Niño over in June 2016, and issued a “watch” for La Niña, the cool phase of ENSO.
About these data
This image of sea surface temperature departures is from a dataset that combines in situ (“on site”) measurements, like those recorded by buoys, and near-real-time satellite observations. Using both sources generates high resolution images that show fine-scale details in our oceans.
These daily, high-resolution sea surface temperature data provide a detailed first glance at ocean conditions during an evolving El Niño or La Niña, which can then be used to help “start up” (or in scientist-speak, initialize) forecast models. Because they are more detailed, they also make more interesting images.
However, our experts caution, if your goal is to compare the relative strength of El Niño events over time, these maps are not your best option. Just like two scales may not give you the exact same weight, satellite-based datasets from different eras (different missions) can have subtle differences, not all of which can be accounted for—at least not with the precision required for comparing events that may only differ from one another by just a few tenths of a degree.
For historical comparisons, you need datasets that have been purposefully pieced together into a seamless, long-term record specifically for that purpose.
For more El Niño updates, please follow the Climate.gov ENSO Blog or read the latest monthly El Niño advisory update, which is issued the second Thursday of every month from the NOAA Climate Prediction Center.