Sea ice withers while phytoplankton blooms in the Arctic
Details
Single-celled algae that rely on sunlight to survive form the basis of the food chain throughout the world’s oceans. In the Arctic, these algae can live in sea ice (ice algae) and in the water column (phytoplankton). Scientists use satellite-based observations of chlorophyll (the green pigment vital for photosynthesis) as a proxy for phytoplankton productivity. According to the 15th annual Arctic Report card, the productivity of these microscopic ocean plants has increased as summer sea ice has declined over the past two decades.
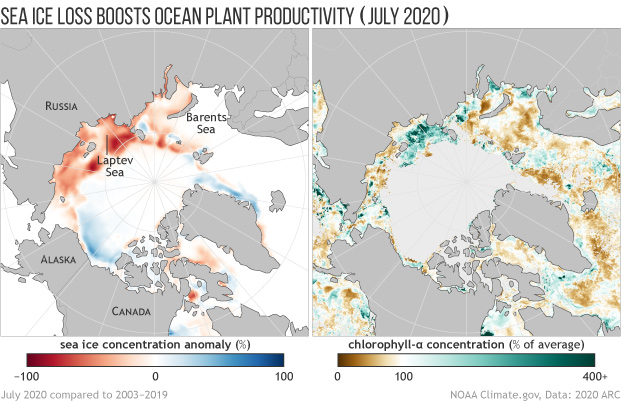
Adapted from the 2020 Arctic Report Card, these maps show the connection between chlorophyll concentrations and sea ice concentrations in July 2020. Both maps show departures from the 2003–2019 average. In the sea ice map, above-average concentrations are blue, and below-average concentrations are orange or red. In the chlorophyll map, above-average concentrations are blue-green, and below-average concentrations are brown. The solid light gray area in the chlorophyll map shows where no chlorophyll data exist due to persistent ice cover or clouds. Below-average sea ice generally correlates with above-average chlorophyll.
Scientists have found that the early retreat of sea ice generally drives primary productivity in the Arctic, opening up ocean waters to sunlight sooner. This relationship is illustrated well in the Laptev Sea, which experienced substantial departures from average in both sea ice and chlorophyll. The 2020 Arctic Report Card noted that chlorophyll concentrations were roughly twice the 2003–2019 average for July, and roughly six times the 2003–2019 average for August.
Across most of the Arctic in 2020, estimated primary productivity was above the 2003–2019 average, with the exceptions of the Sea of Okhotsk and Bering Sea. Despite year-to-year variation, however, all nine regions continue to exhibit positive trends over the 2003–2020 period, with the strongest trends in the Eurasian Arctic, Barents Sea, and Greenland Sea.
Although a useful indicator of primary productivity in the Arctic, satellite-observed chlorophyll is an imperfect measurement. It does not measure ice algae, nor does it measure phytoplankton blooms under the sea ice, both of which likely make a significant contribution to the Arctic food web and carbon cycle. Nevertheless, the picture that we can obtain from satellites indicates productivity is increasing in the Arctic’s open water areas in the summer.
Warming and further sea ice loss will continue to drive changes in ocean plant productivity and the Arctic food web, triggering a cascade of changes that may be good for some species and harmful to others. For example, according to other experts who contributed to the 2020 Arctic Report Card, the increase in primary productivity has contributed to increases in the bowhead whale population in the Pacific Arctic. At the same time, algae species capable of producing deadly neurotoxins are spreading poleward. According to the 2018 Arctic Report Card, “The northward shift of HABs [harmful algal blooms] means that the Arctic region is now vulnerable to species introductions and increasing bloom frequency in local communities and ecosystems that have little to no prior exposure to this phenomenon.”
Reference
Frey, K.E., Comiso, J.C., Cooper, L.W., Grebmeier, J.M., Stock, L.V. (2020). Arctic Ocean Primary Productivity: The Response of Marine Algae to Climate Warming and Sea Ice Decline. Arctic Report Card: Update for 2020.