  • Home
  • News & Features
  • Maps & Data
  • Teaching Climate
  • About
  • Contact
  • FAQs
  • Site Map
  • What's New?
  • El Niño & La Niña

Climate news, stories, images, & video (ClimateWatch Magazine)

  • News
  • How the Climate System Works
  • Climate Change & Global Warming
  • Natural Climate Patterns
  • Climate Impacts
  • Observing & Predicting
  • Policy & Planning
  • Extreme Events
  • Home
  • News & Features
  • Images & Video
  • Science on a Sphere Takes U.S. Center’s Stage at COP15

Science on a Sphere Takes U.S. Center’s Stage at COP15

December 17, 2009

Science on a Sphere.png

Alternate Versions: 

Science on a Sphere COP15.jpg

Image icon Science on a Sphere COP15.jpg
Rating: 
No votes yet
Share This: 
Topics: 
Global Energy Balance
Measurements and Observations
Climate Projections
Category: 
How the Climate System Works
Climate Change & Global Warming
Natural Climate Patterns
Observing & Predicting
Department: 
Images & Video
Dr. Alexander E. “Sandy” MacDonald made the Earth spin a little faster on Dec. 8, 2009, using the visually powerful Science on a Sphere to illustrate how climate change will transform the planet if we do nothing about our emissions of greenhouse gases.

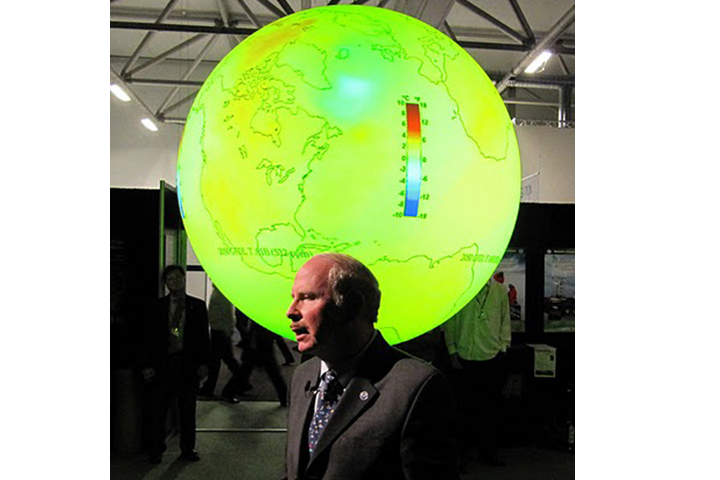
Dr. MacDonald, Director of NOAA’s Earth System Research Laboratory, presented a live “SphereCast” from the United Nation’s Climate Change Conference (COP15) in Copenhagen, Denmark, speaking to local audience of about 30 and many hundreds more who watched the presentation from 11 museums and other institutions around the world. Science on a Sphere —a room sized, global display system that uses computers and video projectors to display planetary data onto a six foot diameter sphere — was the centerpiece of the U.S. Center at the conference.

The sequence of images Dr. MacDonald showed on the sphere indicated how temperatures are projected to rise this century, assuming the world experiences very rapid economic growth, low population growth, and gradual introduction of new and more efficient technology.  The colors on the globe indicate projected temperature differences from those observed in 2000. The projections are calculated by sophisticated computer models that simulate Earth’s climate based on current scientific observations and understanding. In his SphereCast, Dr. MacDonald presented simulations from three independent global climate models, all of which are able to reproduce current climate conditions. He also used those climate models to illustrate that policies—such as those under consideration at Copenhagen to limit greenhouse gas emissions—can change the planet’s future.

Related Links

U.S. Official COP15 Website

U.S. Department of Commerce COP15 Website

United Nations Official COP15 Website


You Might Like

Heavy downpours more intense, frequent in a warmer world

March 4, 2014

Will the Arctic be free of summer sea ice in 30 years?

May 13, 2010

Shifting ocean surface saltiness from 2004-2013

July 28, 2014

Climate Science 101: What is the Difference Between Weather and Climate?

February 15, 2012

climate.gov

  • Home
  • News & Features
  • Maps & Data
  • Teaching Climate
  • About
  • Contact
  • FAQs
  • Site Map
  • What's New?

Follow Climate.gov

Follow us on twitter
Follow us on Facebook
Follow us on Instagram

Subscription link to sign up for Climate.gov's weekly update newsletter

2014 Webby Award winning website

Webby Award Webby Award

Click each award to learn more

  • Information Quality
  • NOAA Freedom of Information Act
  • Privacy Policy
  • Disclaimer
  • USA.gov
  • ready.gov