Are you dreaming of a white Christmas?
Details
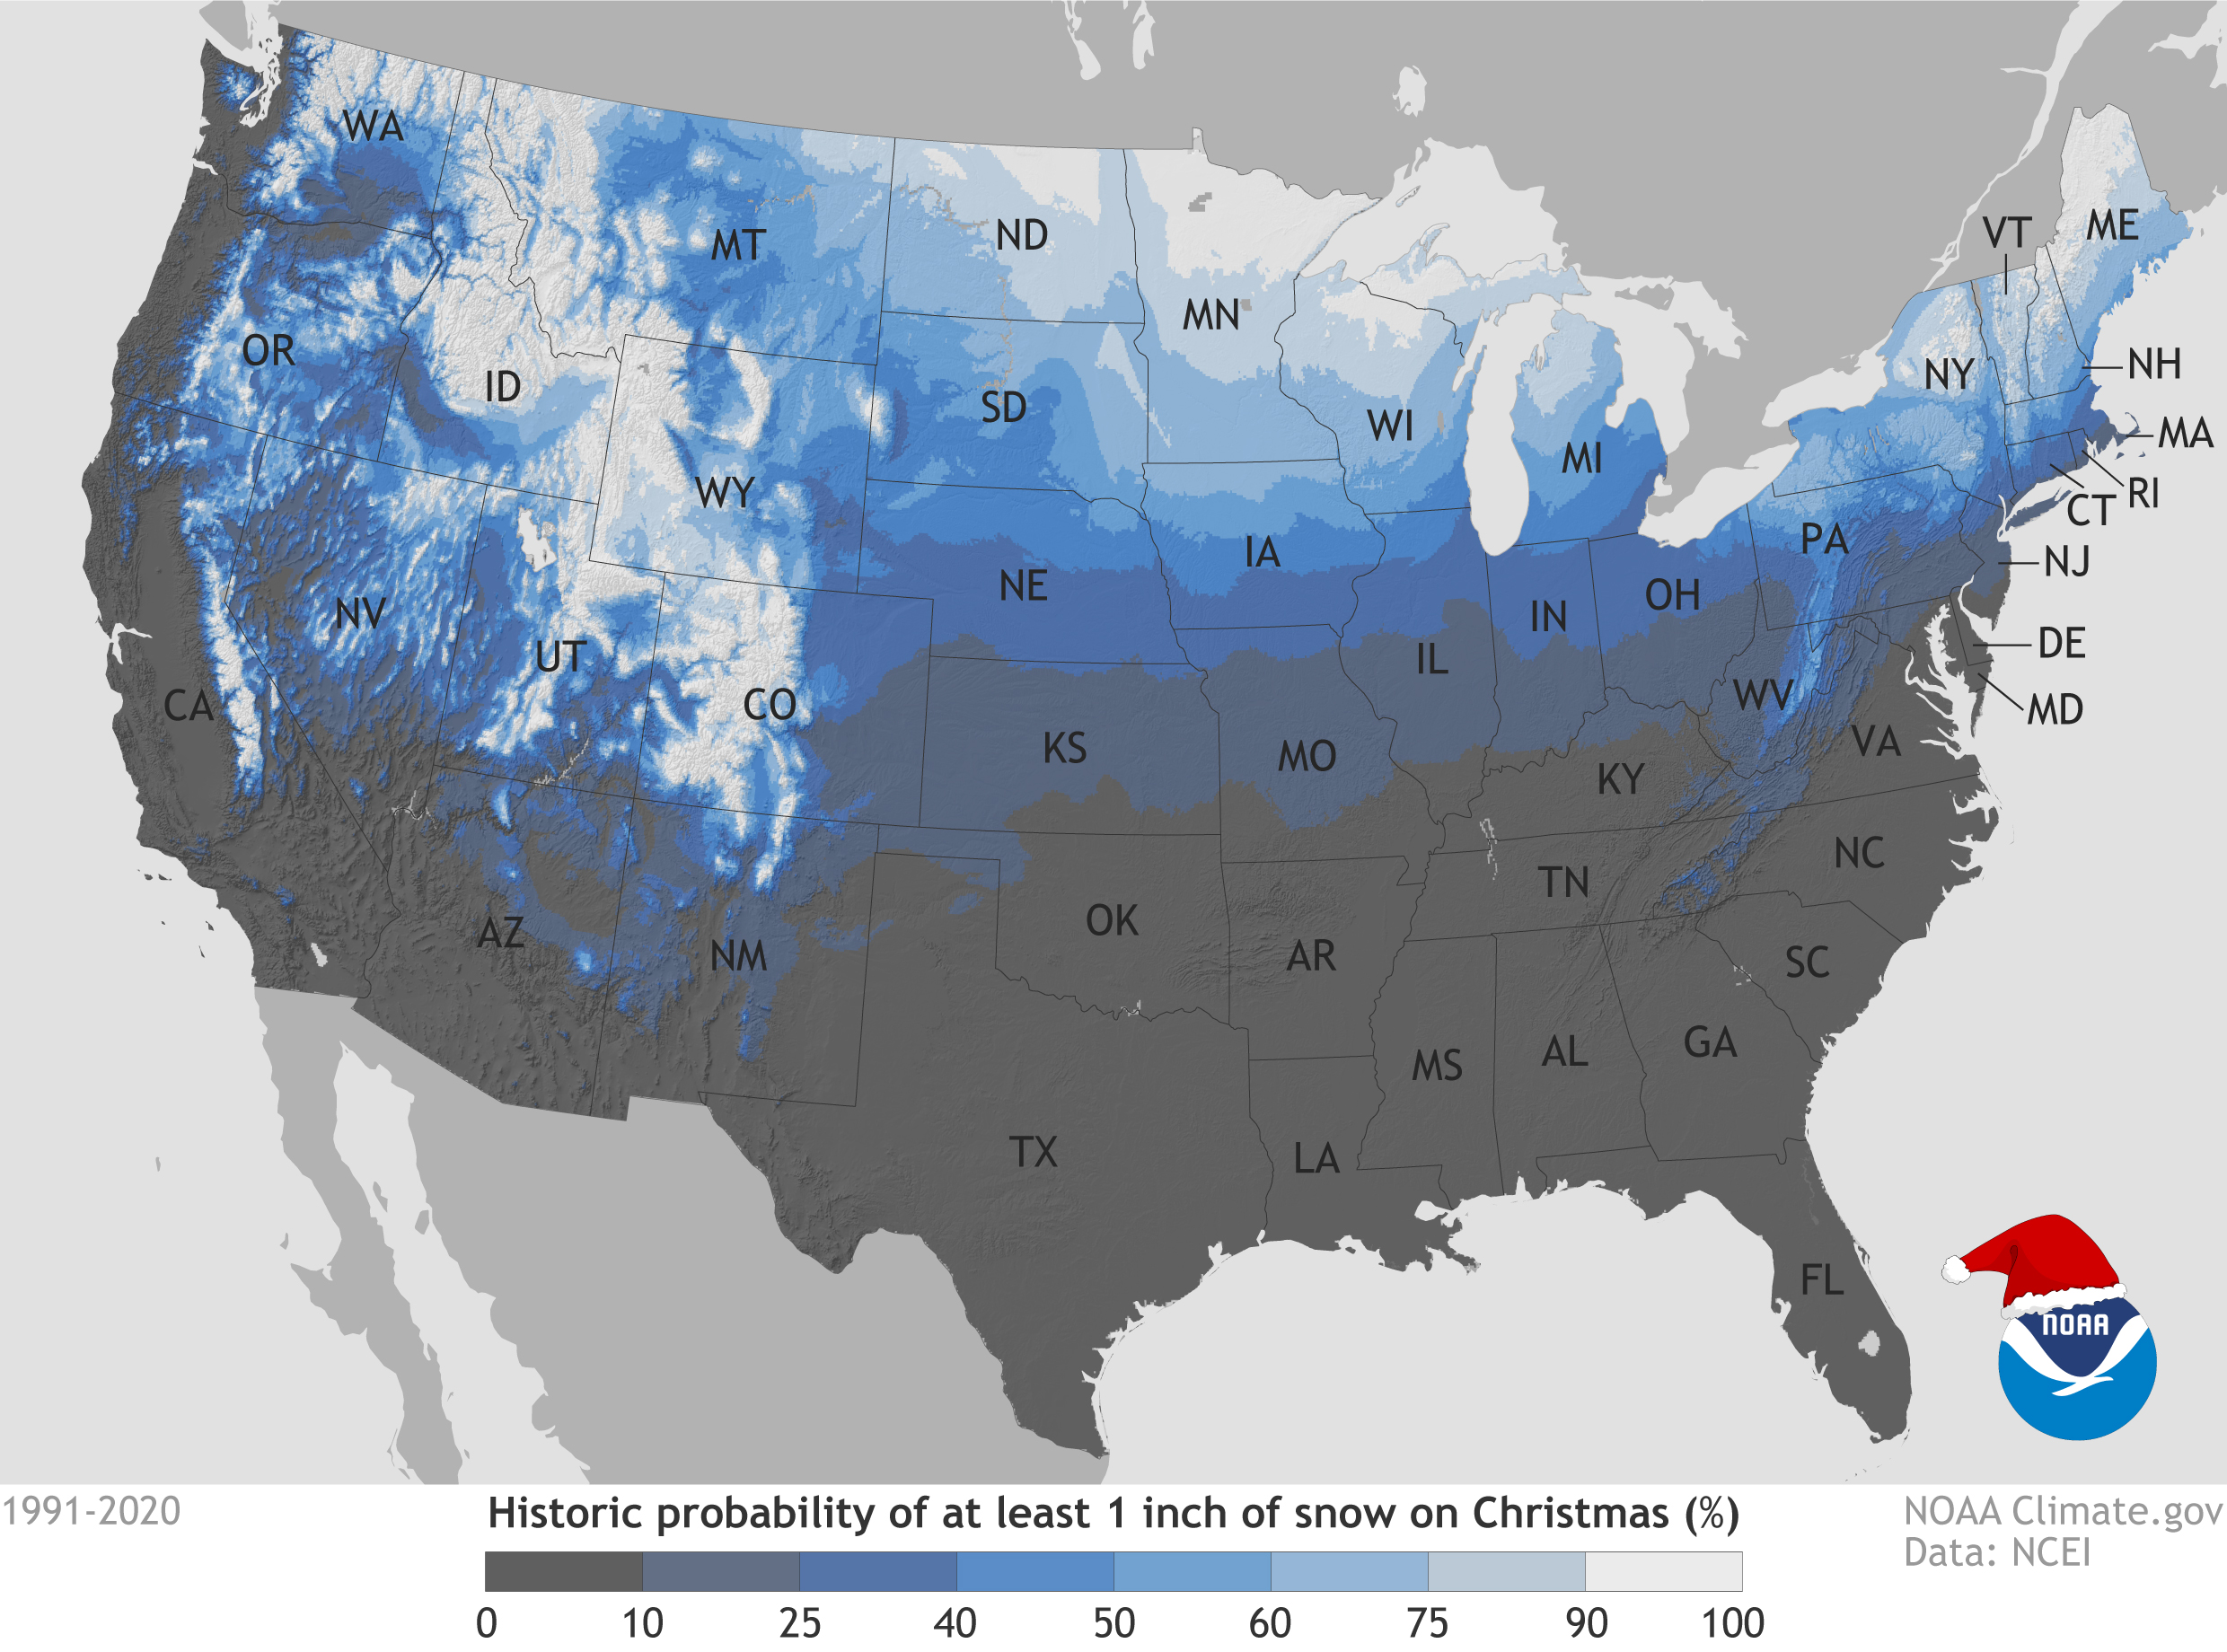
Minnesota. Maine. Upstate New York. The Allegheny Mountains of Pennsylvania and West Virginia. Practically anywhere in Idaho. And of course, the Rockies or the Sierra Nevada Mountains. These are the parts of the United States where weather history suggests you want to be if you're looking for the best chance of a white Christmas.
This map shows the historic probability of there being at least 1 inch of snow on the ground at weather stations across the United States on December 25 based on the latest (1991-2020) U.S. Climate Normals from NOAA National Centers for Environmental Information (NCEI). Using those station data, experts interpolated values for all locations in the Lower 48. (Interpolating means estimating values where you don’t have direct observations, using existing observations and physical relationships, such as the way temperature changes with altitude.) Darkest gray shows places where the probability is less than 10%. (Sorry West Coast, Gulf Coast, Deep South!) White shows probabilities greater than 90 percent.
- Explore an interactive version of this map, which includes station-based data for Alaska.
The 1991–2020 Climate Normals are the latest three-decade averages of several climatological measurements. This collection contains daily and monthly Normals of temperature, precipitation, snowfall, heating and cooling degree days, frost/freeze dates, and growing-degree days calculated from observations at nearly 15,000 stations, the majority of which are operated by operated by NOAA National Weather Service.
While the map shows the historical probability that at least 1 inch of snow will be observed on December 25, the actual conditions in any year may vary widely from these because the weather patterns present will determine the snow on the ground or snowfall on Christmas day. These probabilities are useful as a guide only to show where snow on the ground is more likely. For prediction of your actual weather on Christmas, check out your local forecast at Weather.gov.
A comment on climate change
Long-time readers of Climate.gov will know that this map is an update of an analysis originally made by NCEI experts using data from the 1981-2010 U.S. Climate Normals. If you’re tempted to compare the two maps for signs of the influence of long-term warming, keep a few things in mind.
First, comparing two adjacent Normals periods is not the most direct way to look for climate change. From one 30-year Normals period to the next, two decades of the data are the same; only one decade out of three is new. This gradual introduction of a single decade of new data means that most changes from one Normals period to the next will be relatively small compared to the trend between the oldest decade and the most recent decade. It also means that at some locations, changes could be the result of natural decadal variability.
Second, there are plenty of places in the U.S. where the temperature in late December is frequently well below freezing. Monthly or annual average air temperatures in those areas could be warming over the long-term—and they are, for most of the country—without causing a noticeable decline in the chance of snow on any given late December day at any given location. Snow cover on a specific day of a specific year is largely a product of day-to-day weather systems, rather than long term climate trends.
All that said, however, the spatial fingerprints of climate change that we’d expect based on our modelling studies are visible in national patterns of change in temperature and precipitation Normals. So, it’s not surprising that there are some subtle differences between the 1981-2010 version of the white Christmas map and the 1991-2020 version that are consistent with the reality of long-term warming. More areas experienced decreases in their chances of a white Christmas than experienced increases. The easiest one to spot with the naked eye is the expansion of the dark gray area, where the chances of a white Christmas are less than 10%. The gray area shifted noticeably northward across the South, and upslope along the ocean-facing slopes of some of the West Coast mountain ranges.
Beyond those broad strokes, local changes between the two maps would have to be carefully investigated and placed into context with other climate data and analysis techniques better suited for detecting long-term change.
More snow data
- For a more detailed assessment of the probability of a white Christmas as well as documentation of the methodology used to calculate the map’s underlying climatological statistics, see the scientific paper, White Christmas? An Application of NOAA’s 1981-2010 Daily Normals, by NCEI scientists and published in the Bulletin of the American Meteorological Society. You can also download a spreadsheet to see the full list of stations and their historic probabilities.
- If you would like to keep track of the snow cover across the United States on a daily basis, see the National Operational Hydrologic Remote Sensing Center’s National Snow Analyses.
- Daily snow depth and snowfall extremes for U.S. locations are available from NCEI’s Snow and Ice monitoring page.
- Monthly snow cover images from satellite data back to the late 1960s are available from Rutgers Snow Lab.