2019 Arctic Report Card: Melt season on Greenland Ice Sheet rivals record for area and duration
Details
The Greenland Ice Sheet contains enough stored water to raise sea level by more than 24 feet (7.2 meters) as it melts. How fast that will occur is one of the big unknowns for predicting the pace of sea level rise over the rest of the century. Glacier experts think the ice sheet was likely in balance in the decades leading up to 1990, but since then, it has been losing mass at an accelerating pace.
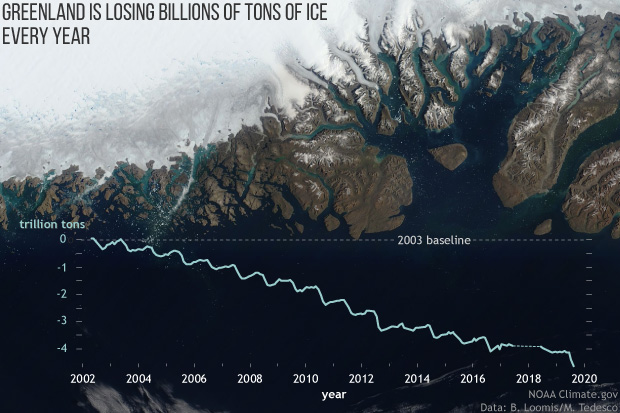
Adapted from the 2019 Arctic Report Card, this graph shows month-to-month changes in Greenland ice mass from April 2002–April 2019 overlaid on a NASA satellite image of the northwest coast of the island (rotated counterclockwise about 90 degrees) from July 19, 2019. Each peak in the graph shows the snow mass gained during the winter; each valley shows summer losses through surface melting and glacier thinning and retreat. The 17-year trend is estimated to be -267±3 billion tons per year, which is enough to have raised sea level by nearly 12 millimeters (0.5 inches).
In the satellite image, sapphire blue melt ponds and streams are visible along the low elevations of the ice sheet margin which appears gray where snow has melted and dirty ice is exposed. Surface melting in summer 2019 was unusually widespread and early, according to the Arctic Report Card, starting in mid-April, 6-8 weeks sooner than average. Under high pressure and sunny skies, roughly 95 percent of the surface experienced melting at some point in the summer, well above the 1981-2010 average of about 64 percent, equivalent to the previous record set in 2012. The highest one-day melt extent was 60.9 percent on July 31. Around the northern margin of the island, the melt season lasted at least 20 days longer than average.
Based on preliminary analysis combining observations and models since 1948, the exceptionally early and widespread melt in 2019 is likely to have led to the biggest one-year ice mass loss on record for the Greenland Ice Sheet.
This image is adapted from NOAA’s 2019 Arctic Report Card, which provides an annual update on observations from the Arctic, documenting changes in the physical environment—including sea ice, the atmosphere, snow, the Greenland Ice Sheet, and carbon stored and released by permafrost—and the impacts on people, plants, and animals that live there. This peer-reviewed collection of essays is part of NOAA’s mission to help the nation understand and prepare for the risks and opportunities of a changing climate.