So far, 2017 has been a wet one for California. Incredibly heavy precipitation in January has caused flash floods and mudslides and covered higher elevations in feet of snow. Precipitation totals during January are quickly putting the 2016-2017 water year (October 2016-September 2017) onto a record pace.
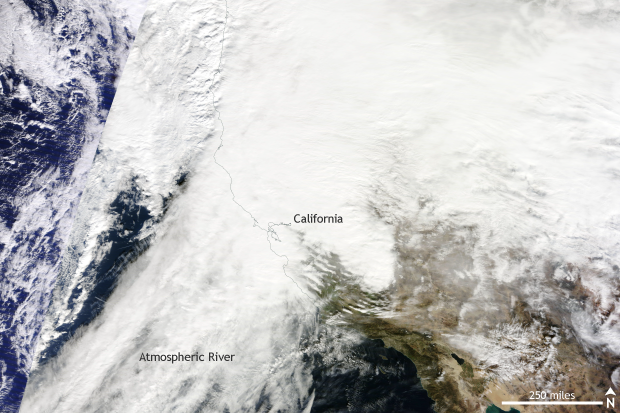
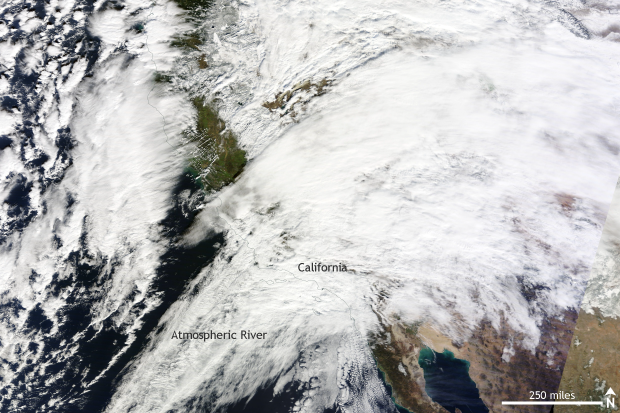
Satellite image taken on January 8, 2017. Heavy rains and higher elevation snow battered California during a multi-day atmospheric river event. NASA MODIS/TERRA satellite image taken from NASA Worldview.
Rowing down the atmospheric river
The heavy rain and higher elevation snow is the result of multiple atmospheric river events along the West Coast. Atmospheric rivers are narrow streams of moisture flowing directly from the humid tropics. The West Coast relies on these events for around half of their precipitation during the winter wet season. Not surprisingly, precipitation totals from recent atmospheric rivers have been astounding.
During the first 11 days of the month, precipitation totals statewide were around 25% of the average annual rainfall for the entire state of California. From January 7-9, the remote, elevated, notoriously rainy observation site in Venado, California, received over a foot of rain. Sacramento, meanwhile, is experiencing its fourth wettest January in history with wet season rainfall totaling 192% of normal.
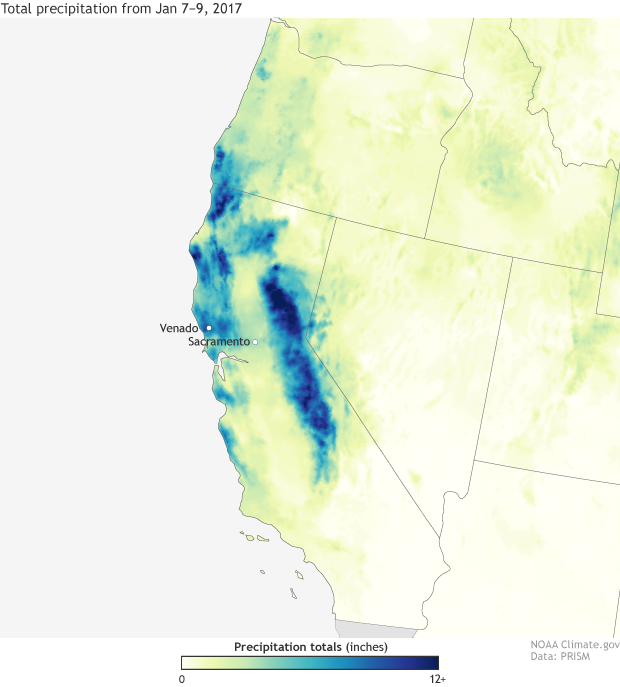
Accumulated precipitation (inches) from January 7-9, 2017. An atmospheric river brought flooding rains and heavy, higher elevation snow to central and northern California. NOAA Climate.gov map based on data from PRISM.
Later in the month, the atmospheric fire hose was pointed a bit farther south. From January 18-22 extremely heavy rains fell farther south in California. Long Beach observed 3.97 inches of rain on January 22 which set an all-time daily rainfall record. Los Angeles recorded 2.94 inches which set a new daily record. Rains in Los Angeles since the start of the water year in October are more than 200% of average; remarkable considering that Los Angeles had just come off one of the driest five-year periods on record. In general, precipitation during the month of January has been well above-average for much of the state.
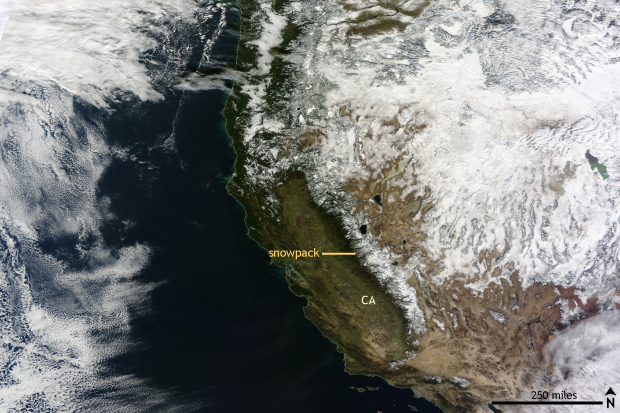
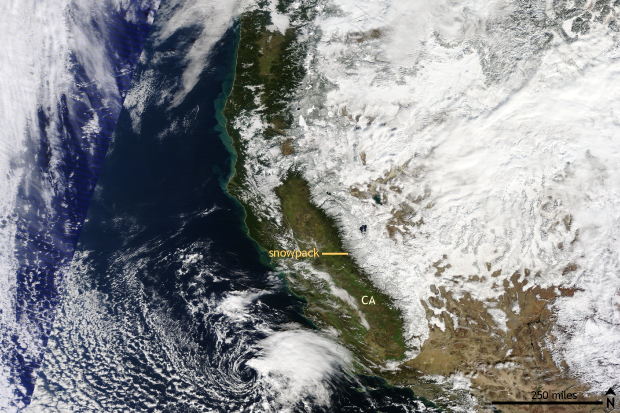
Grab and drag the slider to compare the before (left) and after (right) images of an atmospheric river event in California in January 2017. NASA MODIS satellite images from Worldview.
What about in the higher elevations? Enough snow for skiers?
Precipitation across the higher elevations in California is on a record pace for the 2016-2017 water year. In the North Sierra Nevada Mountains, the average accumulation at 8 weather stations so far this water year is 53.2 inches, already higher than the seasonal average from 1922-1998. Precipitation this year is even outpacing the wettest year on record (1982-83) for the region.
Through January 22, January has been the third wettest on record. And much of that precipitation has fallen as snow. From January 4-11, six to twelve feet of snow fell across the Sierra Nevada Mountains. The snowpack in the Sierra Nevada Mountains increased from 6.5 inches on January 1 to 20.1 inches by January 12! If all of the snow was melted down into liquid – known as the snow water content – the amounts in northern California would already be over 90% of the average yearly peak, which usually occurs in April.
For ski resorts, it might be too much snow. Resorts in the Sierra Nevadas had to close temporarily to allow workers to dig out and make sure conditions were safe for skiers. Mammoth Mountain has set a January record for snowfall as totals have reached 246 inches from the start of the month to January 24. The previous record was a measly 209 inches.
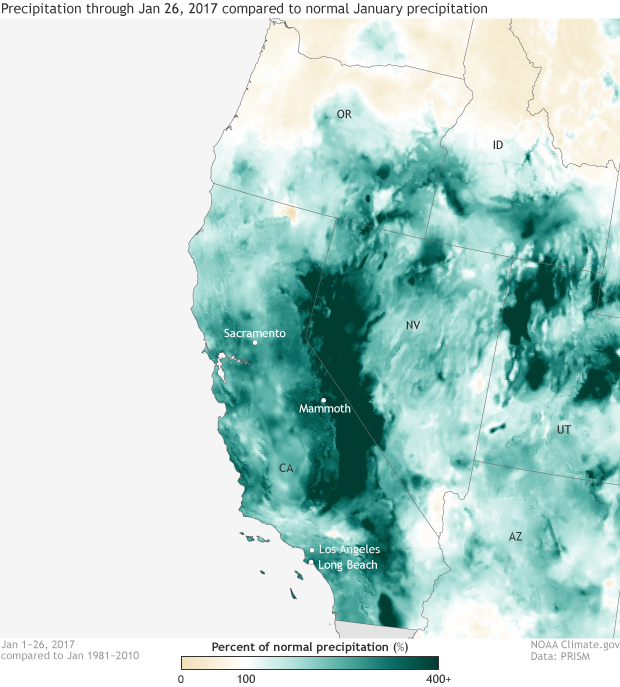
Percent of normal precipitation totals through January 26, 2017, compared to normal January precipitation. Multiple atmospheric river events during January led to well above average precipitation across widespread areas. NOAA Climate.gov image, based on data provided by PRISM.
Any good news for drought relief?
The state of the many reservoirs across the state is vital for drought relief. The heavy rains have left the two largest reservoirs in the state– Lake Shasta and Lake Oroville – at 116% and 124% of average respectively as of January 30. This represents a huge change from just a few years ago.
As for the drought itself, according to the latest U.S. Drought Monitor issued on January 24, 51% of California is still experiencing drought conditions but no location is under the worst drought category, D4-Exceptional Drought. While this is still substantial, it is a far cry from where the state started its water year at the end of September. Back then, 83.5% of the state was in drought with an astounding 21% of California experiencing exceptional drought. (Keep your eyes peeled for a nationwide status report on drought later this week in our Beyond the Data blog.)
Satellite image taken on January 22, 2017. Heavy rains were focused on southern California during a multi-day atmospheric river event bringing record rainfall to areas around Los Angeles. NASA MODIS/TERRA satellite image taken from NASA Worldview.
Tom’s Climate Change Corner
Extreme precipitation events can sometimes be linked to our changing climate, such as, a recent extreme rainfall event in Louisiana. While it generally takes a specific kind of analysis (an extreme event attribution study) to conclusively link a specific event to climate change, we can look at what science tells us might have occurred already or could occur in a climate changed future.
The National Climate Assessment reports that extreme precipitation events across the southwestern United States have increased 5% from 1958 to 2012. Outside of Hawaii–which has seen a 12% reduction in extreme precipitation–the region has seen the smallest increase in extreme precipitation of anywhere across the United States. Projections into the future if we maintain our continued greenhouse gas emissions, however, indicate that increases in heavy precipitation events will continue for all regions of the country.
Recent research by scientists at MIT has even suggested that three additional extreme precipitation events like those just seen in California are likely to occur per year, on average, in a scenario where Earth’s average temperature rises by 4°C (7°F) by 2100 (Gao et al , 2016).
It’s safe to say that California is going through weather whiplash, bouncing from one extreme to the next. Hopefully, the recent rains mark the end of the worst of the recent drought. But for many Californians, you are not out of the redwoods yet.
References
X. Gao, C.A. Schlosser, P. O’Gorman, E. Monier and D. Entekhabi, 2016. 21st Century Changes in U.S. Regional Heavy Precipitation Frequency Based on Resolved Atmospheric Patterns. J. Climate