Persistent cold temperatures in the Midwest this winter have almost completely frozen over many of the Great Lakes. The Great Lakes Environmental Research Laboratory (GLERL) reported that 88 percent of the Great Lakes were frozen as of mid-February. The last time ice cover was even close to this extent was in 1996, when maximum seasonal ice cover was approximately 82 percent.
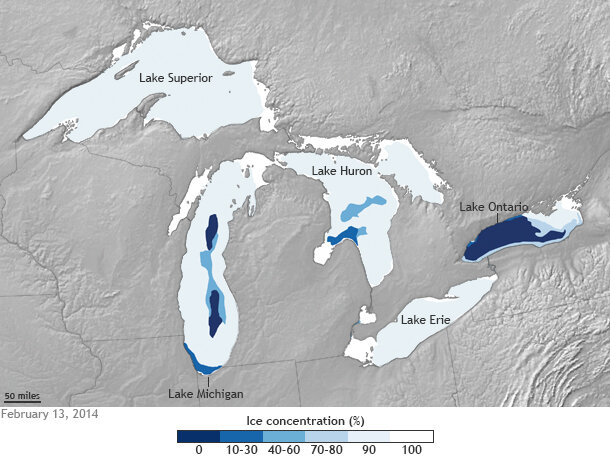
Percent ice cover on the Great Lakes on February 13, 2014. Shades of blue indicate ice concentration, with the darkest shade of blue indicating areas where 0 percent of the water’s surface is frozen, and white indicating areas where the water is entirely frozen over. Map by NOAA Climate.gov, based on data provided by the U.S. Naval Ice Center.
The map shows ice coverage on the Great Lakes on February 13. Shades of blue indicate ice concentration, with the darkest shade of blue indicating areas where 0-10 percent of the water’s surface is frozen and white indicating areas where the water is entirely frozen over. Lakes Superior, Erie, Huron, and St. Clair were 90-100 percent ice covered, while Lakes Michigan and Ontario were 82 percent and 43 percent ice covered, respectively. Overall, 88 percent of the Great Lakes were frozen on this date—the most extensive total ice coverage observed so far this winter.
Maximum ice cover on the lower lakes normally occurs between mid-February and end of February, while the maximum on the upper lakes normally occurs between the end of February and early March. According to the Midwest Regional Climate Center, average temperatures were below normal across the region during the second week of February. If cold temperatures persist, the MRCC reports, “it is possible that the Great Lakes could approach the record-setting year of 1979, which recorded 94.7 percent maximum ice coverage.”
But while ice cover and water levels are known to vary on the Great Lakes from year to year, scientists have observed an overall decrease in ice extent since records began in the early 1970s. From 1973 to 2010, annual ice coverage on the Great Lakes declined by 71 percent (relative to 1973).
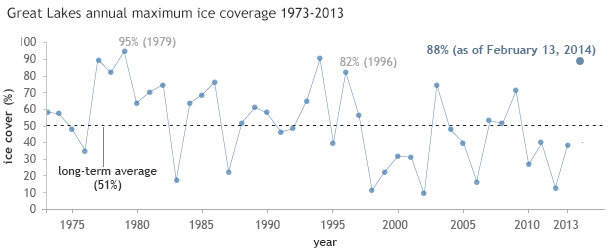
Percent ice cover on the Great Lakes at winter maximum each year since 1973. The dashed line shows the long-term average of 51%. Prior to the mid-1990s, most years were above the long-term average; since then, most years have been below average. As of February 13, 2014, the lakes were 88% ice covered. Graph adapted by NOAA Climate.gov, from an original provided by The Great Lakes Environmental Research Lab.
According to the 2009 National Climate Assessment, higher temperatures could mean more evaporation from the upper Great Lakes and hence a likely reduction in some Great Lakes water levels. Lower water levels could have potential impacts on the major industries that depend upon the lake—hydropower generation, commercial shipping, and fishing—as well as recreational beaches and coastal ecosystems.
So far this winter, extensive ice cover has allowed access into previously inaccessible ice caves near Lake Superior and provided a safe landing spot for an airplane experiencing an emergency over Lake Huron. The effects of extensive ice cover could even last into the summer and fall, potentially contributing to cooler water temperatures. Since the ice must be melted first before the water below it can be warmed, the lakes could heat up slower—although weather conditions and heat storage in the lakes will be contributing factors as well, according to an FAQ on the GLERL website. Lower water temperatures could also potentially reduce evaporation from the lakes this year, which could help drive water levels up.
This post was originally published on February 24, but an editor accidentally deleted it. It was re-posted on February 26.
Resources
Midwest Regional Climate Center
Great Lakes Ice Cover (GLERL)
2009 National Climate Assessment
Related Links
Great Lakes Ice Cover - Frequently Asked Questions. Great Lakes Environmental Research Laboratory.