Does it matter how much the United States reduces its carbon dioxide emissions if China doesn’t do the same?
Yes, it matters. Observed and anticipated increases in greenhouse gas emissions from China and other countries don’t let Americans off the hook for reducing emissions. From a purely physical perspective, any reduction in emissions helps minimize future temperature increases. From the perspective of fairness, the United States has released more heat-trapping gases to date than either China or India, the world’s two most populous countries. Carbon dioxide is a long-lived greenhouse gas that can linger in Earth’s atmosphere for thousands of years. Consequently, the United States bears more responsibility for the amount of warming that has occurred so far and will persist for millennia.
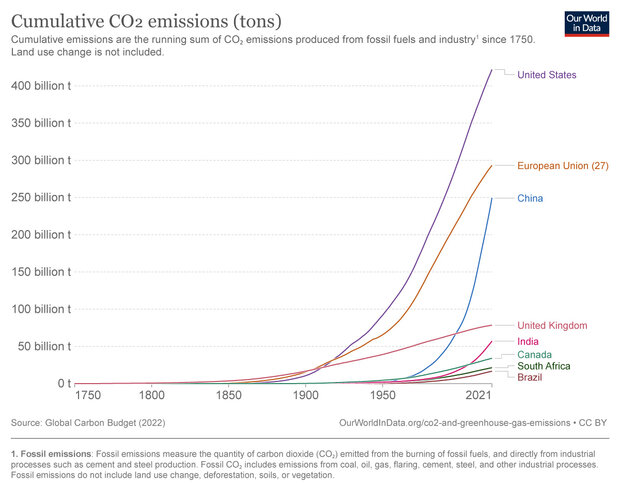
Global carbon emissions began to rise measurably in the mid-nineteenth century. Total U.S. emissions still remained above China’s and India’s through 2021. Credit: Our World in Data
The global carbon budget
The United States, along with close to 200 other countries, is a party to the 2015 Paris Agreement. The agreement aims to limit “the increase in the global average temperature to well below 2°C [3.6 ˚F] above pre-industrial levels.” Participating nations also agree to try “to limit the temperature increase to 1.5°C [2.7 ˚F] above pre-industrial levels.”
To meet these goals, humans can emit only so much more carbon dioxide, whether through fossil fuel burning, cement production, or land use change. Just as a household working with limited financial resources must adhere to a financial budget, nations trying to limit further warming must collectively adhere to a carbon budget.
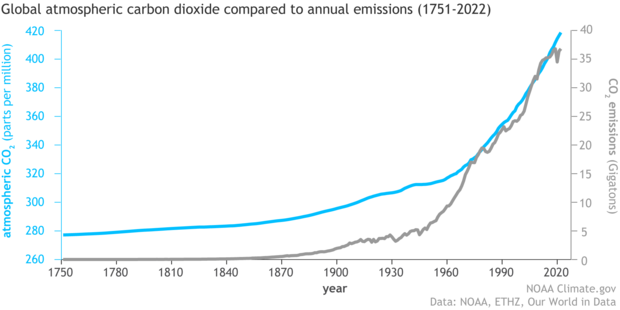
The amount of carbon dioxide in the atmosphere (blue line) has increased along with human emissions (gray line) since the start of the Industrial Revolution in 1750. Emissions rose slowly to about 5 gigatons—one gigaton is a billion metric tons—per year in the mid-20th century before skyrocketing to more than 35 billion tons per year by the end of the century. NOAA Climate.gov graph, adapted from original by Dr. Howard Diamond (NOAA ARL). Atmospheric CO2 data from NOAA and ETHZ. CO2 emissions data from Our World in Data and the Global Carbon Project.
In Climate Change: Physical Science Basis—part of its Sixth Assessment Report (AR6)—the Intergovernmental Panel on Climate Change (IPCC) released estimates of the allowable carbon emissions from the start of 2020. To have a 50 percent chance of capping global warming at 1.5°C above pre-industrial levels, the group estimated that humanity should limit emissions to no more than 500 billion metric tons. For a 50 percent chance of capping global warming at 2.0°C above pre-industrial levels, humans should limit emissions to 1,350 billion metric tons. To raise the odds of hitting those targets, we would have to emit even less.
Unfortunately, most of the estimated global carbon budget for the 1.5°C target has been spent. The AR6 concluded that humans had already burned through about four-fifths of the budget. In November 2022, the Global Carbon Project published updated estimates of the allowable carbon emissions to limit further warming. Taking into account the continued emissions since the IPCC AR6 publication, the Global Carbon Project estimated that maintaining a 50 percent chance of meeting the 1.5°C target meant limiting future emissions to 380 billion metric tons. Maintaining a 50 percent chance of meeting the 2°C target meant limiting future emissions to 1,230 billion metric tons.
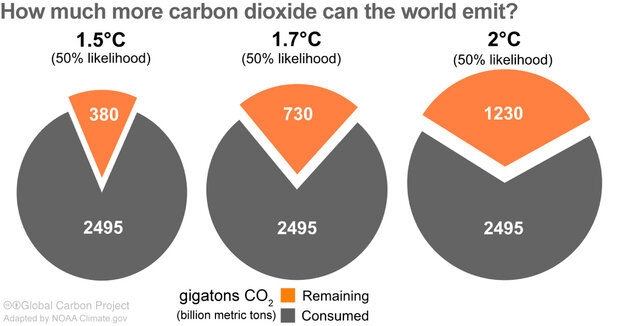
Each pie chart shows how much carbon dioxide the world has already added to the atmosphere through 2022 (gray) and how much additional carbon dioxide we can add (orange) if we want at least a 50 percent chance of limiting global warming to (left to right) 1.5, 1.7, or 2.0 degrees Celsius (2.7, 3, or 3.8 degrees Fahrenheit) above the pre-industrial global average temperature. Most of what we can emit and still keep temperatures below these amounts has already been released. Image provided by the Global Carbon Project. Used under a Creative Commons license.
Some countries have spent much more of the budget than others.
Big spenders
The Industrial Revolution began in the mid-eighteenth century, and global carbon dioxide emissions began rising measurably about a century later. Western Europe industrialized early, as did parts of the United States and Canada. Further boosting carbon emissions throughout the nineteenth century, waves of European settlers cleared forest for farmland in the United States and Canada.
By comparison, China and India have been relative latecomers to industrialization, although China is ramping up quickly. Even so, both countries have remained behind the United States in per person emissions and total cumulative emissions. In fact, at China’s 2021 rate of 11.47 gigatons per year, it would take roughly 15 years to match the U.S. historical contribution. At India’s 2021 rate of 2.71 gigatons per year, it would take about 135 years to catch up to the United States.
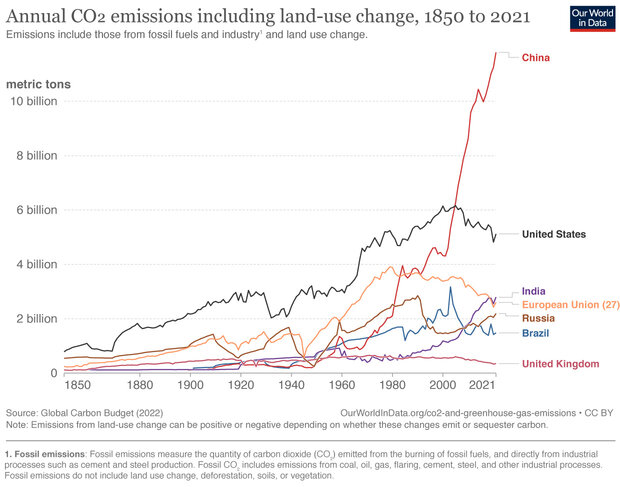
Annual carbon dioxide emissions from selected developed and developing countries from 1850-2021. Until the start of the new millennium in 2000, the United States (black line) emitted more carbon dioxide to the atmosphere each year than any other country, including all the countries of the European Union combined.(orange line). Since the mid-2000s, China's annual emissions (red line) have been the world's largest. Graph from Our World in Data, based on data from the Global Carbon Project.
In 1973, U.S. per capita carbon dioxide emissions were 20 times those of China’s and 66 times those of India’s. By the year 2000, when many U.S. policymakers and consumers were aware of the effects of greenhouse gas emissions, U.S. per person emissions had dropped to just over 21 metric tons per year, while China’s and India’s had risen to 2.9 and 0.9 respectively. That meant U.S. per person emissions were seven times those of China’s and 23 times those of India’s. Since then, the United States' per person emission rate has continued to drop, but the country's 2021 per person carbon dioxide emissions were still nearly twice as large as China's and nearly 8 times as large as India's. (Explore these and other comparisons through the interactive charts and maps at the excellent Our World in Data: CO2 emissions site.)
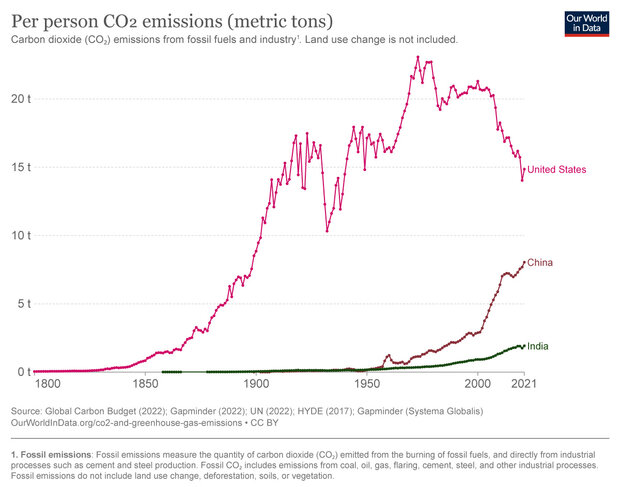
The United States lowered per capita carbon dioxide emissions starting in the 1970s, but still led both China and India through 2021. Credit: Our World in Data
Furthermore, national emissions are not wholly independent of each other. Much of China’s rising emissions are related to manufacturing, with many of the resulting products increasingly purchased by American consumers. The United States imported $450.4 billion worth of goods from China in 2020 alone, according to the Office of the United States Trade Representative. (Our World in Data allows users to view emissions adjusted by production and consumption of imported and exported goods.)
How much of the carbon budget does the United States have left?
If we agree to the premise that each country is entitled to use up a chunk of the remaining carbon budget that’s proportional to its population, the United States has nothing left to spend. In fact, the United States has overspent, according to a new analysis by Scientific American.
The study tallied historical emissions by country, divided each nation’s carbon budget by world population to arrive at a per person carbon budget, then multiplied the per person budget by national population. By this measure, the United States has overspent its carbon budget by roughly 346 billion metric tons. Scientific American found that Russia, the European Union, and the world’s highest per person emitters at present (Qatar, Bahrain, and Kuwait) have also exceeded their carbon budgets.
The United States’ big population partially contributes to national carbon overspending, but keep in mind that China and India each have roughly four times the U.S. population. As of 2021, according to Our World in Data, the United States population was 337 million while China’s was 1.43 billion and India’s was 1.41 billion.
In short, the United States bears a greater share of the responsibility for current conditions—on both a national and per-person level.
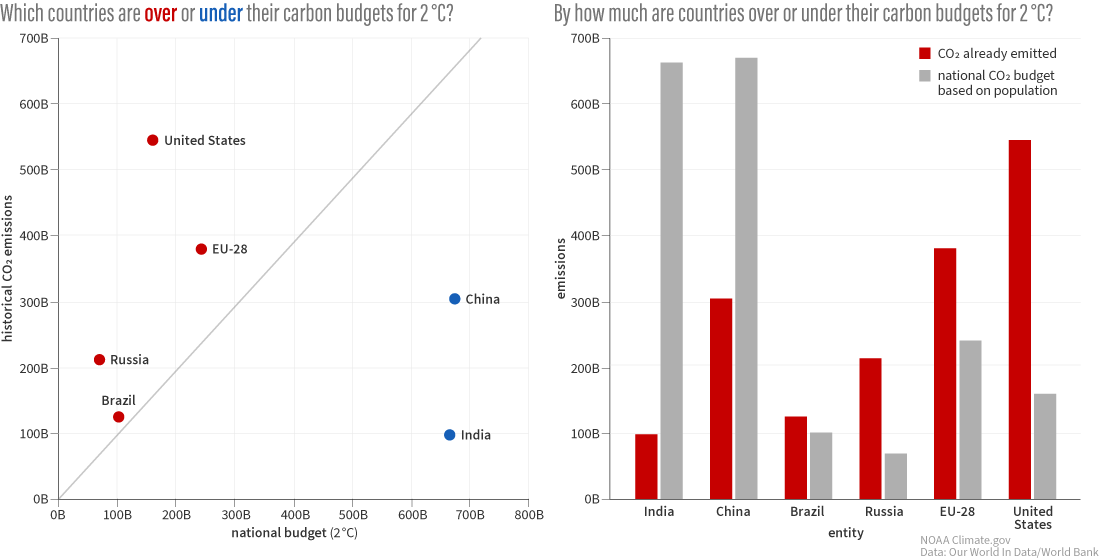
The world can only emit a certain amount of carbon dioxide if we want a reasonable chance of limiting global warming to no more than 2°C (3.6 ˚F) above pre-industrial temperatures. (left) The location of the dots indicates how much carbon dioxide a country has already emitted (vertical axis, in billions of metric tons) versus its remaining population-based budget (horizontal axis). The United States, Brazil, Russia, and the European Union plus the United Kingdom (EU28) are all above the red diagonal line, meaning they have already "overspent." China and India are below the line, which means they have emitted less carbon dioxide to date than they would be allowed based on their population. (right) Red and gray bars compare how much a country has already emitted (red) and how much of its budget remains (gray). U.S. emissions to date dwarf its remaining national budget. NOAA Climate.gov graphic by Ben Everett-Lane, based on data from Our World in Data and World Bank.
Any reduction in emissions is beneficial
Rising emissions from China and India could eventually overshadow total U.S. emissions, and could easily push global warming past the 1.5°C goal, and even past the 2°C goal. This looming possibility might make U.S. emission reductions seem pointless, but they are not. If heat-trapping emissions continue, where they originate won’t matter nearly as much as how big they are and how long they continue.
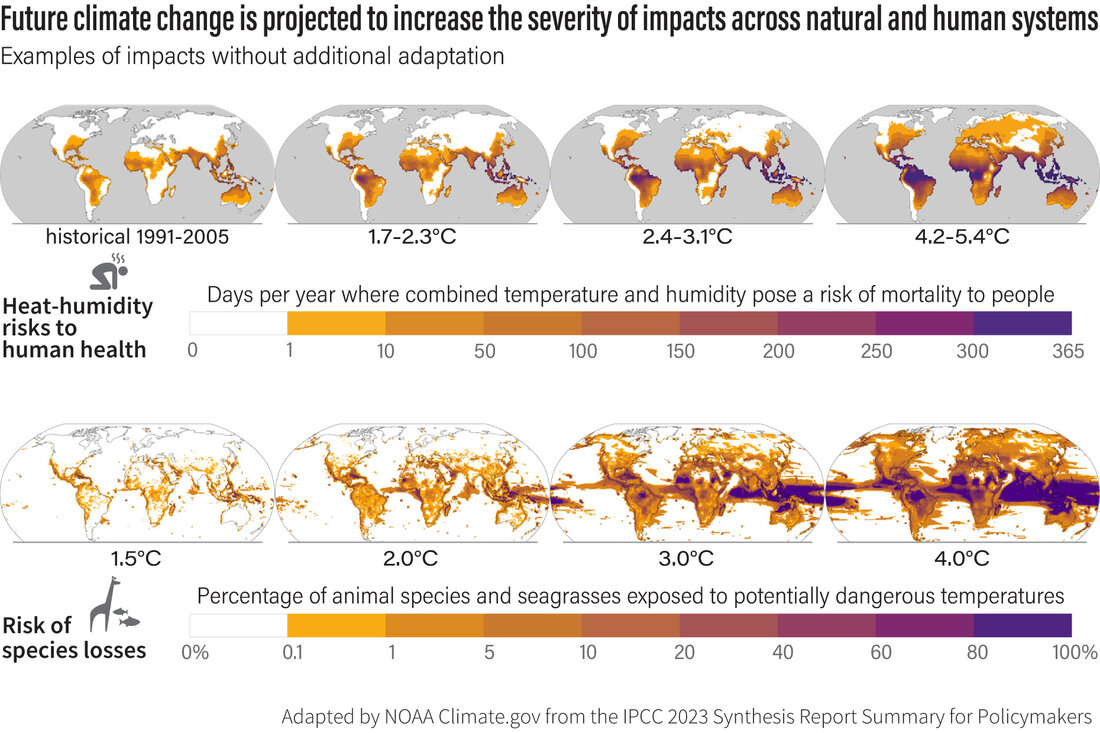
(top) Global maps showing how often people in different places have historically been exposed to dangerous combinations of heat and humidity (far left), and how the area and number of days will increase (left to right) with increased warming if no adaptation takes place. Even with the lowest levels of warming, some parts of the tropics may face potentially deadly heat and humidity nearly year round (darkest purple). (bottom) Global maps showing the increasing percentage of more than 30,000 species of animals and sea grasses that are likely to be exposed to dangerous heat with greater amounts of global warming. NOAA Climate.gov graphic adapted from Figure SPM.3, on page 16 of the Summary for Policymakers, in the IPCC Sixth Assessment Report: Synthesis Report.
The smaller the increase in average global temperatures over the next several decades, the better off humanity and other life on Earth will be. A temperature increase of 2.5°C is better than 3°C, which is better than 3.5°C, and so on. Even though the United States no longer leads the world in total annual carbon dioxide emissions, it was still, as of 2021, releasing about 5 billion metric tons of carbon dioxide per year, which was about 13.49 percent of the total global emissions—more than twice that of all 28 countries in the European Union combined. Those emissions will continue to drive global warming. Combined with the contribution that past U.S. emissions have made to warming to date, any future U.S. emissions will undermine progress to stop global warming.
References and resources
Environmental Protection Agency. Climate Change Indicators: Greenhouse Gases. Accessed August 1, 2023.
Evans, S. (2021, October 5). Analysis: Which countries are historically responsible for climate change? Carbon Brief.
Intergovernmental Panel on Climate Change. (2018). Special Report: Global Warming of 1.5ºC.
Intergovernmental Panel on Climate Change. (2023). AR6 Synthesis Report: Climate Change 2023.
Jones, N. (2023). When will global warming actually hit the landmark 1.5ºC limit? Nature. https://doi.org/10.1038/d41586-023-01702-w.
Office of the United States Trade Representative. The People’s Republic of China. Accessed June 13, 2023.
Our World in Data. Accessed June 13, 2023.
Tans, P.P. (1998). Why carbon dioxide from fossil fuel burning won’t go away. In Macalady, D.L. (ed.), Perspectives in Environmental Chemistry, Oxford University Press, Oxford.
Thompson, A., Montañez, A. (2023, April 5). Wealthy countries have blown through their carbon budgets. Scientific American.
United Nations. The Paris Agreement. Accessed June 13, 2023.