In Hawaii and the Pacific Islands, 2017 has been anything but normal
The climate of the islands of Hawaii and the Pacific is often characterized by iconic scenes of warm, sandy beaches, blue skies, and swaying palm trees. However, these scenes can be dramatically transformed when sea levels become anomalously high or low, wave action increases due to nearby storms, and drought or heavy rains impact local food supplies. In other words, there can be climate trouble even in paradise.
Most regions of the United States fall within major land areas, and their weather and climate are well observed by ground-based stations. However, the tropical Pacific spans thousands of miles on end without land, and this geography makes it difficult to collect weather and climate data effectively. To evaluate climate in this vast ocean region, we must use other sources of data in conjunction with traditional land-based station data. Data from satellites have proven indispensable in meeting these challenges.
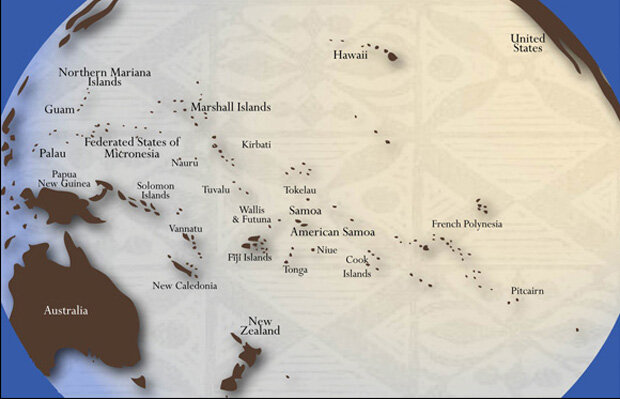
Hawaii and the U.S.-affiliated Pacific Islands. Map courtesy NOAA's Pacific RISA.
In this Beyond the Data post, we will explore what has been happening so far in 2017 across Hawaii and the U.S. Affiliated Pacific Islands (USAPI) and describe the data and mechanisms by which we monitor weather and climate in a region generally devoid of surface-based observations.
Sea Level
For coastal communities, sea level at high and low tide is one of the most important climate variables. It matters to everyone from hotel and resort owners, to fishermen, to city officials, to surfers. Since late April 2017, sea level around Hawaii has been so high that the measurements are breaking records. Waves have run-up to the sidewalks along famous Waikiki Beach on Oahu, resulting in less than ideal surfing conditions: the waves are breaking too close to shore instead of safely over the outer reefs.
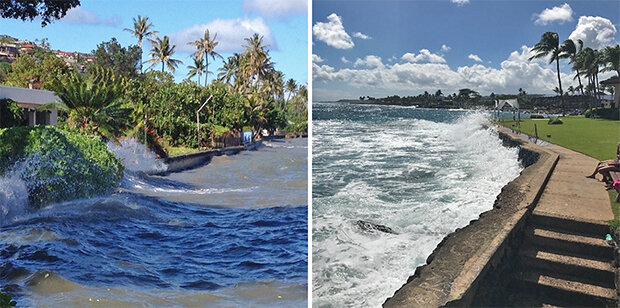
High sea levels resulted in wave run-up across Hawaii in May-August 2017. Photos courtesy of the Hawaii Sea Grant King Tides Project.
The sea level anomalies recorded in Honolulu during May-August have been the highest ever, with observed values of 20 centimeters (8 inches) above normal in April, +17 centimeters (6.7 inches) during May, +9 centimeters (3.5 inches) in both June and July, and +10 centimeters (4 inches) in August. Data from the Honolulu tide gauge shows the increasing trend in sea-level since 1905, with the recent events in 2017 above all others.
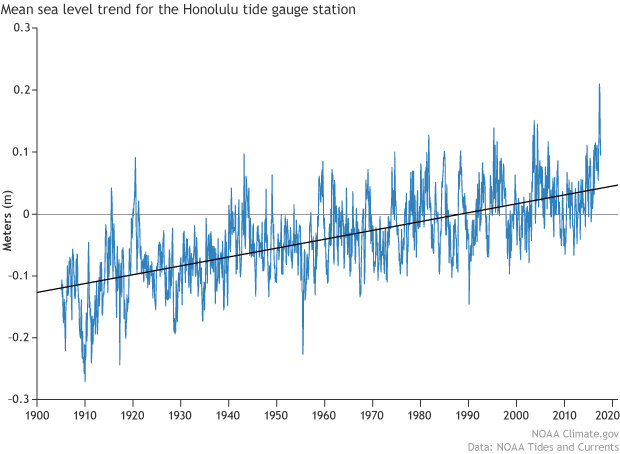
Mean sea level trend for the Honolulu tide gauge station. Data and plot courtesy of NOAA Tides and Currents.
The currently high sea levels around Hawaii are only part of the story. While tide gauges for the surrounding Pacific Islands are sparse, altimeter data from the Jason-3 satellite show that these unusually high sea levels have also extended westward across other Pacific islands, including the Republic of the Marshall Islands, the Federated States of Micronesia, parts of Guam, and the Commonwealth of the Northern Marian Islands. So what’s causing these high sea levels?
Behind the surge
It turns out it’s a combination of several factors. First, there is variability associated with the El Niño Southern Oscillation (ENSO), which has trended toward La Niña over the last few months. In La Niña years, sea levels across the western Pacific rise higher than normal, while they fall below normal in the eastern Pacific like a see-saw (and the reverse is true in El Niño years).Combine that with localized ocean eddies and global sea-level rise due to climate change and the result is anomalously high sea levels.
On top of those elements, high water levels are exacerbated by the highest tides of the year (also commonly referred to as “King Tides”, which refers to an especially high tide that occurs only a few times per year), and wave action from long-period swell or storm surge. This combination results in significant wave run-up along the shores, filling roads with saltwater and washing sand onto sidewalks.
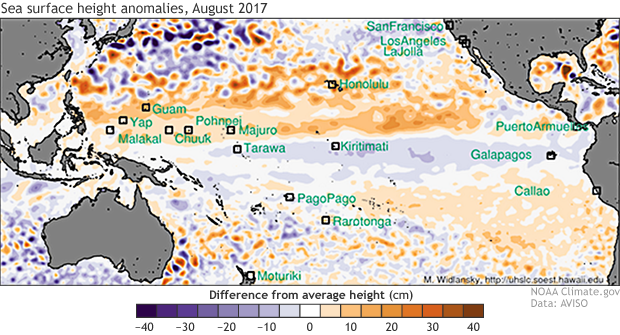
Satellite observations of sea level anomalies for the Pacific. Note the unusually high values in orange (much higher than usual sea level) spread out between Hawaii and Guam. More info: https://uhslc.soest.hawaii.edu/.
Rainfall extremes
Abundant rainfall occurred throughout most of the U.S. Pacific island region during the first half of 2017, with almost all recording stations reporting above-average first-half totals. It was one of the wettest spring periods on record in Pohnpei, and some flash flooding was even reported in American Samoa during May.
However, rainfall patterns over the last three months of June, July, and August have been much drier than normal across the region. Radar data from NASA’s Global Precipitation Measurement satellite highlights the drier areas across Micronesia, the Marshall Islands, and southern Marianas Islands.
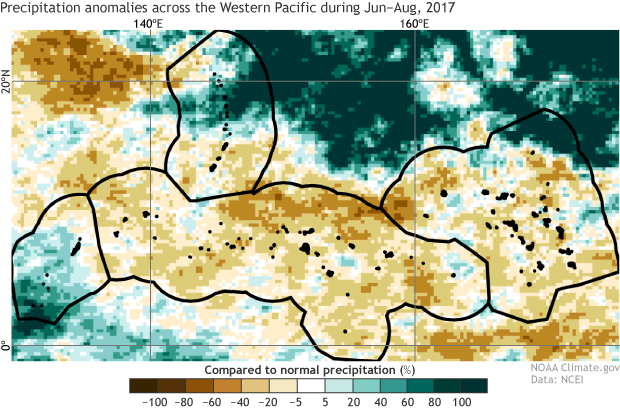
Satellite-derived precipitation anomalies across the western Pacific with respect to the percent of normal (average) rainfall. Original plot from Michael Kruk, NCEI.
The dry weather has resulted in drought development across the northern Marshall Islands and across some of the northern atolls of Chuuk State. Conditions were so severe that the government had to ship bottled drinking water supplies and reverse-osmosis units to a few atolls to address water shortages. The September 12 experimental U.S. Drought Monitor analysis for the region indicates that the northern atolls of Utirik and Wotje are still experiencing extreme drought.
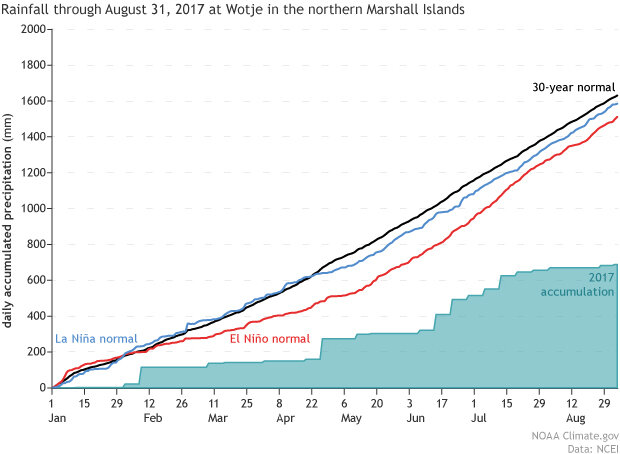
Rainfall through August 31, 2017, at Wotje in the northern Marshall Islands. The shaded green area denotes the annual accumulation so far, while the lines represent long-term averages under normal, El Niño, and La Niña conditions. Original plot by Michael Kruk at NCEI.
Sea surface temperatures
Sea surface temperature data from NOAA’s Optimum Interpolation Sea-Surface Temperature (OISST) dataset indicate that many areas were warmer than normal across much of the Pacific during the first 8 months of 2017, with a small, localized region of cold anomalies now starting to develop along the equatorial eastern Pacific.
Weekly sea surface temperatures from July 2–September 17, 2017, compared to the 1981-2010 average. Note the warmer waters in the western Pacific and the developing La Niña (cooler than average waters) in the equatorial eastern Pacific. NOAA Climate.gov animation, based on maps from NOAA ESRL.
The warmest anomalies, exceeding 1.0 degree Celsius (1.8 degrees Fahrenheit), were located just north of the Hawaiian Islands (north of the equator roughly in image center), with temperatures 0.5 degree C (0.9 degree F) above normal across American Samoa, western Micronesia, and the Northern Marianas Islands. Everywhere west of 120°W, including eastern Micronesia and the Marshall Islands, the surface waters were at least 0.25 degrees C (0.45 degrees F) above normal.
According to NOAA’s Climate Prediction Center, the Pacific region is under a La Niña Watch, with La Niña conditions likely within the next 3 months. La Niña is accompanied by stronger-than-average trade winds from the east, which push the Western Pacific Warm Pool even farther west, colliding with land, and spreading warmer than average water poleward. This shift can cause large-scale warming in the waters around Guam and enhance rainfall over Palau, western Micronesia, and northernmost Northern Marianas Islands.
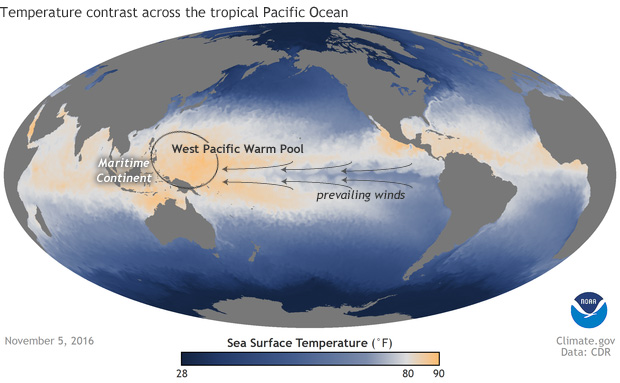
Sea surface temperatures on November 5, 2016. Maintained by the prevailing easterly surface winds, the Western Pacific Warm Pool can be more than 80 degrees Fahrenheit even heading into winter. During La Niña, the winds are even stronger than usual, and the warm pool is pushed even farther west into the Maritime Continent. NOAA Climate.gov map from the Data Snapshots map collection.
In addition to the enhanced rainfall over parts of the western Pacific, the warming sea-surface temperatures affect the local ecology and fishing. In particular, coral heat stresses are on the rise across this area, especially as nighttime temperatures remain elevated due to the warmer waters. This constant state of above-normal water temperatures can lead to coral bleaching and even coral mortality.
Further, tuna fish tend to migrate with the warmest waters of the Pacific. Last year, due to the strong El Niño, fish catches were up across the Hawaiian Islands and down in the western parts of the region. With La Niña, those trends are typically reversed as the tuna move back west with the warmer waters. For those islands that rely on fish for subsistence living, knowing when and where these waters change and move is essential to their overall well-being.
Tropical cyclones
The 2017 tropical cyclone season for the Pacific covers two basins; one for the Hawaiian Islands (central Pacific), and one for the U.S. Pacific islands west of the Date Line (western Pacific). So far in 2017, there have been no storms that have developed in the Central Pacific, and only two very weak systems that moved into the far eastern boundary (140 degrees West) as they drifted out of the eastern Pacific basin. Over the last few years, the Central Pacific has been exceptionally active, with as many as three concurrent major hurricanes, so this year’s quiet stands in quite a contrast to previous seasons.
Meanwhile, in the western Pacific, there have been a near-average number of tropical cyclones (19), but all of them have been north of 15 degrees North and generally west of 140 degrees East, which is mostly outside the area for Guam and other U.S. Pacific islands. In previous seasons with a similar distribution of tropical cyclones at this point in the season, the large-scale pattern was commonly associated with existing or developing La Niñas—more or less similar to what is occurring now.
With so many climate factors at play in the Pacific region, it’s no wonder that 2017 has been anything but normal. Will the rest of the year continue the trend, or will things even themselves out? Only time will tell, but if the developing La Niña is any indication, the rest of 2017 could be a wild ride.
Comments
Comments have been disabled on this article